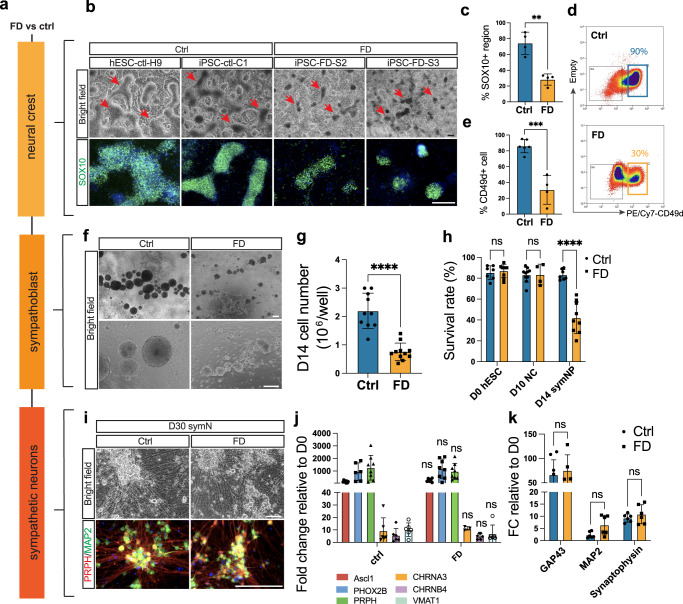
Fig. 1. Developmental phenotypes in Familial Dysautonomia (FD) sympathetic neurons (symNs).
a Schematic workflow of developmental comparisons during symN differentiation in control (ctrl) and FD groups. b Comparison of neural crest cell (NCC) differentiation on day 10. Red arrows indicate the NCC “ridge” structures. Immunostaining in bottom row shows SOX10 (green) positive NCC ridges at high scale. hESC-ctrl-H9 = human embryonic stem cells, WA09, hiPSCs = human induced pluripotent stem cells, C1 = healthy ctrl, S2, S3 = FD patients. c Quantification of SOX10+ cell area in (b). n = 4 biological replicates. Two-tailed Student’s t-test. Error bar represents the SEM. **p < 0.01. d Day 10 NCC number is analyzed by FACS using PE/Cy7-CD49d. Blue rectangle in ctrl and yellow in FD gate CD49d+ fractions. e Quantification of CD49d+ cell number by FACS. N = (ctrl: 6, FD: 4) biological replicates. Two-tailed Student’s t-test. Error bar represents the SEM. ***p < 0.001. f Representative sympathoblast spheroids are compared on day14. g Day 14 total cell numbers after dissociation is compared. N = (ctrl: 10, FD: 11) biological replicates. Two-tailed Student’s t-test. Error bar represents the SEM. ****p < 0.0001. h Survival rates after dissociation are quantified and compared at each stage. SymNP = sympathoblast. N = (D0-ctrl: 7, FD: 9; D10-ctrl: 10, FD: 4; D14-ctrl: 7, FD:9) biological replicates. Two-tailed multiple unpaired Student’s t-test. Error bar represents the SEM. ****p < 0.0001. i Representative differentiated symNs are compared after day 30 in bright field (top row) and PRPH (red)/MAP2 (green) staining (bottom row). j RT-qPCR analysis shows similar expressions of symN markers between control and FD. N = (ASCL1-ctrl: 8, FD: 6; PHOX2B-ctrl: 6, FD: 8; PRPH: 8; CHRNA3-ctrl: 6, FD: 3; CHRNB4: 6; VMAT1: 6) biological replicates. Two-tailed multiple unpaired Student’s t-test. Error bar represents the SEM. k Gene expression of neurite growth markers are further examined using RT-qPCR and no significant difference is found. N = (GAP43-ctrl: 8, FD: 5; MAP2 & SYNAPTOPHYSIN: 6) biological replicates. Two-tailed multiple unpaired Student’s t-test. Error bar represents the SEM. Scale bars represent 200 μm. In c, g, and h, data from hESC-ctrl-H9 and iPSC-ctrl-C1 are pooled as control; data from iPSC-FD-S2 and iPSC-FD-S3 are pooled as FD. See also Supplementary Figs. 1–4. Source data are provided as a Source Data file.

