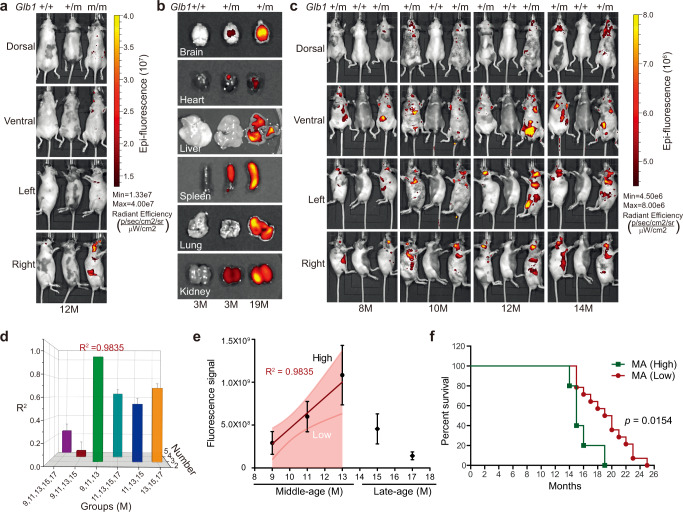
Fig. 4. Live-imaged GAC signal correlates with lifespan.
a Representative images showing live GAC signal detected by an IVIS Lumina II system in Glb1m/m, Glb1+/m, and Glb1+/+ mice at 12 months of age. b Representative images showing live GAC signal in indicated organs isolated from 3-month-old Glb1+/+ and Glb1+/m mice and 19-month-old Glb1+/m mice. c Representative live GAC signal images of a cohort of Glb1+/m mice (n = 60) at indicated ages. A Glb1+/+ mouse was included as a background control. d A cohort of Glb1+/m mice (n = 60) at 9, 11, 13, 15, and 17 months of age were live-imaged, and linear regression between GAC signal and chronological age was analyzed. There was a close correlation between GAC signal and chronological age for months 9, 11, and 13. X-axis, month-groups of mice; Y-axis, numbers of month-groups involved for analysis; Z-axis, R2 of linear regression; Error bar, MSE of linear regression. e Plot showing linear correlation between GAC signal and chronological age in middle-aged mice (MA, 9 to 13 months, n = 27). A 85% confidence interval was applied to define mice with GAC high signal (GACH) and mice with low GAC signal (GACL). Data represent the means ± s.e.m. f Comparison of lifespan between middle-aged mice with high (n = 5) and low (n = 14) GAC signal by the Log-rank (Mantel–Cox) test. “n” represents number of biological replicates.

