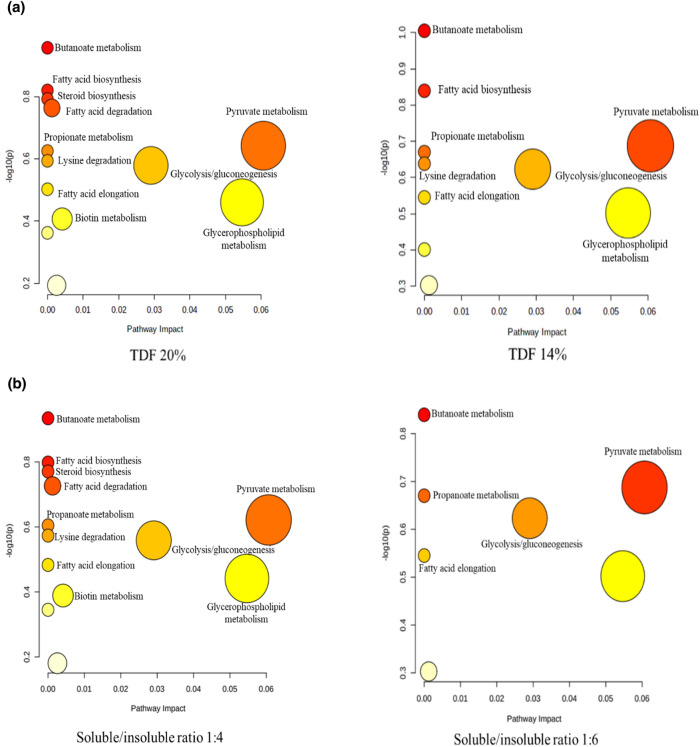
Figure 4 .
Effect of dietary fiber levels and soluble to insoluble dietary fiber ratio on metabolome view map of the differential metabolites (variable importance projection > 1, P < 0.05) identified in the feces of sows during late gestation. (a) 20% vs. 14% dietary fiber level; (b) 1:4 vs. 1:6 soluble to insoluble ratio. The x-axis represents the pathway impact, and the y-axis represents the pathway enrichment. The node color is based on its P-value, and the node radius is determined based on the pathway impact values. Larger sizes and darker colors represent higher pathway enrichment and impact values, respectively.

