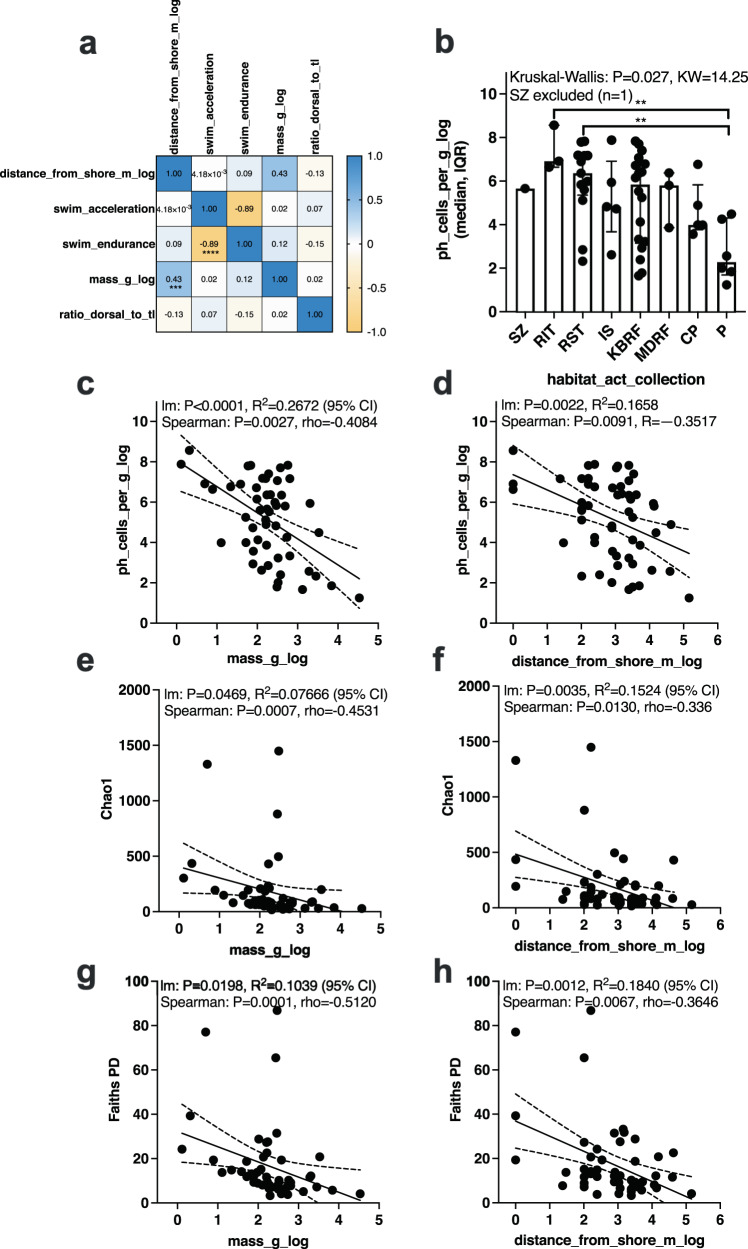
Fig. 4. Associations between fish mass and collection location as measured by distance from shore with fish gill microbial biomass and alpha diversity.
Subset of fish from EPO and Atlantic (n = 54) collected from ocean (excludes bay and estuary samples) and from the neritic zone (<200 m depth). a Correlation matrix between sample metadata where values are rho and significance indicated by *p < 0.05, **p < 0.01, ***p < 0.001, ****p < 0.0001 (Spearman correlation). b Comparison of gill microbial biomass (log cells per gram) across habitat types from which the fish were collected. Distribution is in median and interquartile range. Statistical differences determined using non-parametric testing Kruskal–Wallis test with 0.05 FDR Benjamini–Hochberg. c Comparison of fish mass and d distance from shore with gill microbial biomass. e Comparison of fish mass and f distance from shore with alpha diversity metrics (Chao1). g Comparison of fish mass and h distance from shore with alpha diversity metric: Faith’s PD. c–h (Confidence intervals of 95% are displayed as dotted lines). habitat_act_collection refers to the metadata column name from where this habitat classification can be found…, SZ surf zone, RIT rocky intertidal, RST rocky subtidal, IS inner shelf, KBRF kelp bed rocky reef, MDRF mid depth rocky reef, CP coastal pelagic, P pelagic. Mass_g_log = log 10 (mass of the fish in grams), distance_from_shore_m_log = log 10 (distance from nearest point on shore in meters from where the fish was caught).

