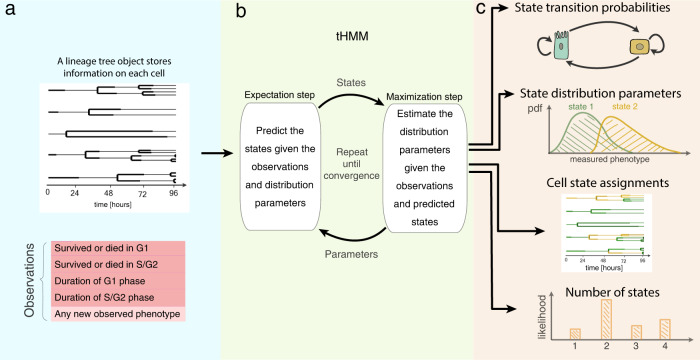
Fig. 2. The tHMM model.
a Input data takes the form of single-cell measurements across time, where the lineage relationship between cells is known. b The fitting process includes expectation and maximization steps, where model parameters are iteratively updated until convergence. c Output predictions of the model after fitting including the tree of inferred cell states, probabilities of transition between each state, starting abundance of each cell state, and distributions that describe the behavior of cells within each state. The model likelihood can be used to estimate the number of distinguishable cell states.

