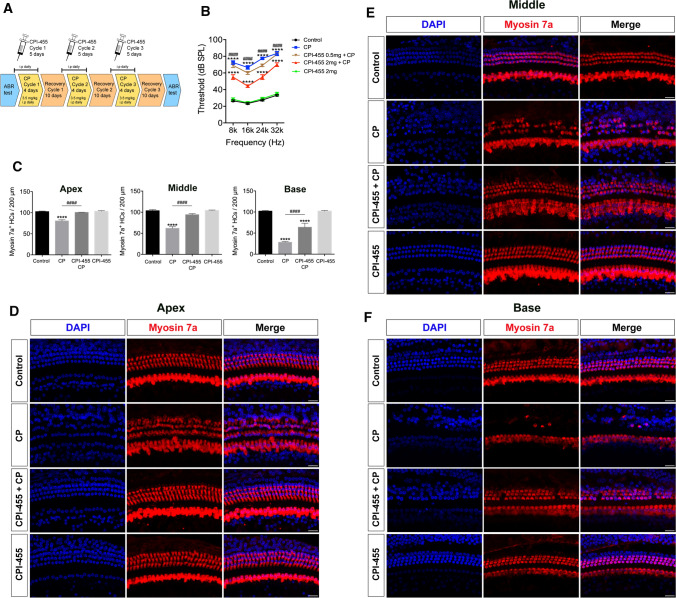
Fig. 5.
CPI-455 protected against CP-induced hearing loss in vivo. A Experimental workflow. B ABR analysis. Data are shown as mean ± SEM values. ****P < 0.0001 compared with the control; ####P < 0.0001 compared with CP only. n = 6 mice for each group. C Graphical representation of the number of Myosin 7a–positive HCs. Data are shown as mean ± SEM values. ****P < 0.0001 compared with the control; ####P < 0.0001 compared with CP only. The experiments were performed in triplicate. n = 10 cochleae for control group; n = 10 cochleae for CP group; n = 10 cochleae for CPI-455 + CP group; n = 10 cochleae for CPI-455 group. D–F Cochleae were stained with Myosin 7a (red) and DAPI (blue). Scale bar 10 µm

