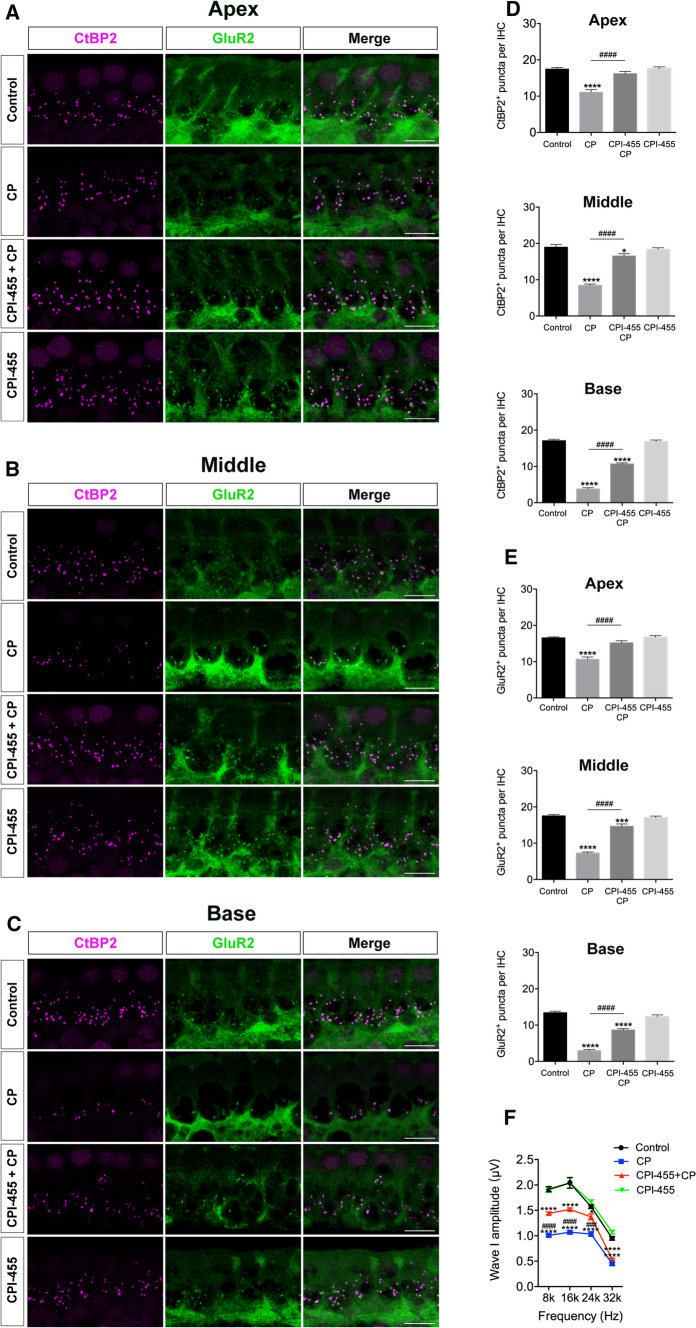
Fig. 6.
CPI-455 protected mice from CP-induced synapses loss. A–C Cochleae were stained for CtBP2 (magenta) and GluR2 (green). Scale bar 10 μm. D, E Quantification of CtBP2-immunolabeled or GluR2-immunolabeled synaptic ribbons per IHCs. The data are presented as the mean ± SEM values. *P < 0.05, ***P < 0.001, ****P < 0.0001 compared with the control; ####P < 0.0001 compared with CP only. The experiments were performed in triplicate. n = 6 cochleae for control group; n = 6 cochleae for CP group; n = 6 cochleae for CPI-455 + CP group; n = 6 cochleae for CPI-455 group. F ABR wave I amplitudes analysis. Data are shown as mean ± SEM values. ****P < 0.0001 compared with the control; ####P < 0.0001 compared with CP only. n = 6 mice for each group

