Fig. 9.
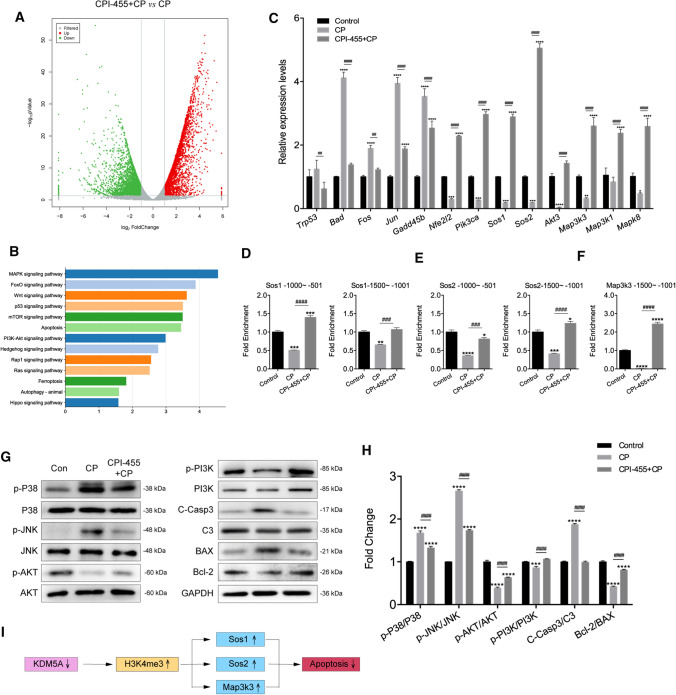
CPI-455 reduced CP-induced HC death via multiple signaling pathways. A Volcano plot representing gene-expression differences between CPI-455 + CP and CP. B KEGG analysis showed the distribution of terms exhibiting statistically significant differences. C The differentially expressed genes were verified in HEI-OC1 cells by qRT-PCR. Data are presented as mean ± SEM values. *P < 0.05, **P < 0.01, ***P < 0.001, ****P < 0.0001 compared with the control; ##P < 0.01, ####P < 0.0001 compared with CP only. D–F Enrichment of H3K4me3 on promoters of Sos1, Sos2, and Map3k3 genes. Data were normalized to the IgG controls. Data are presented as mean ± SEM values. *P < 0.05, **P < 0.01, ***P < 0.001, ****P < 0.0001 compared with the control; ###P < 0.001, ####P < 0.0001 compared with CP only. G, H The protein levels of p-P38, P38, p-JNK, JNK, p-AKT, AKT, p-PI3K, PI3K, C-Casp3, C3, BAX, and Bcl-2 in HEI-OC1 cells. GAPDH serves as an internal control. Data are presented as mean ± SEM values. ***P < 0.001, ****P < 0.0001 compared with the control; ####P < 0.0001 compared with CP only. The experiments were performed in triplicate. I Summary of the working thesis of the study

