
Fig. 2. Ground and excited-state electron densities for the CS ground-state minimum energy structure of MA.
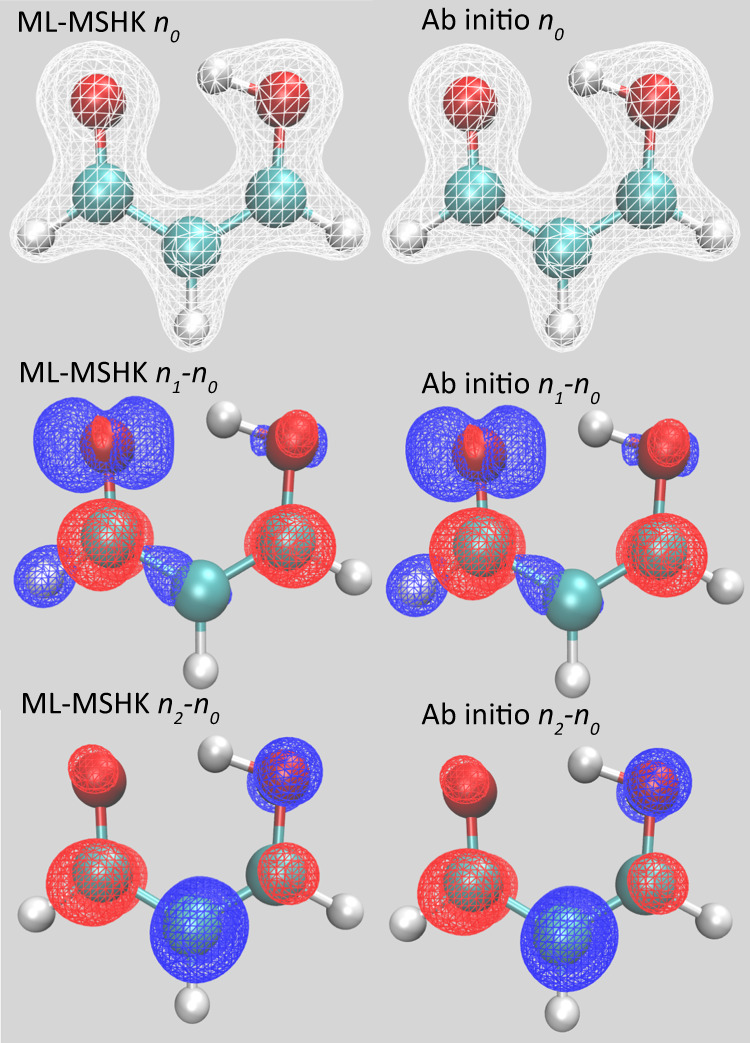
1st row: S0 ground-state densities. 2nd row: density differences between S1 and S0. 3rd row: density differences between S2 and S0. An isosurface of 0.1 e/Bohr3 was used for plotting densities and density differences. Left column: ML predictions, right column: ab initio TD-PBE0 predictions. Each density is represented by an isosurface plot. For density differences, red means an accumulation of electronic charge in the excited state and blue means a depletion.