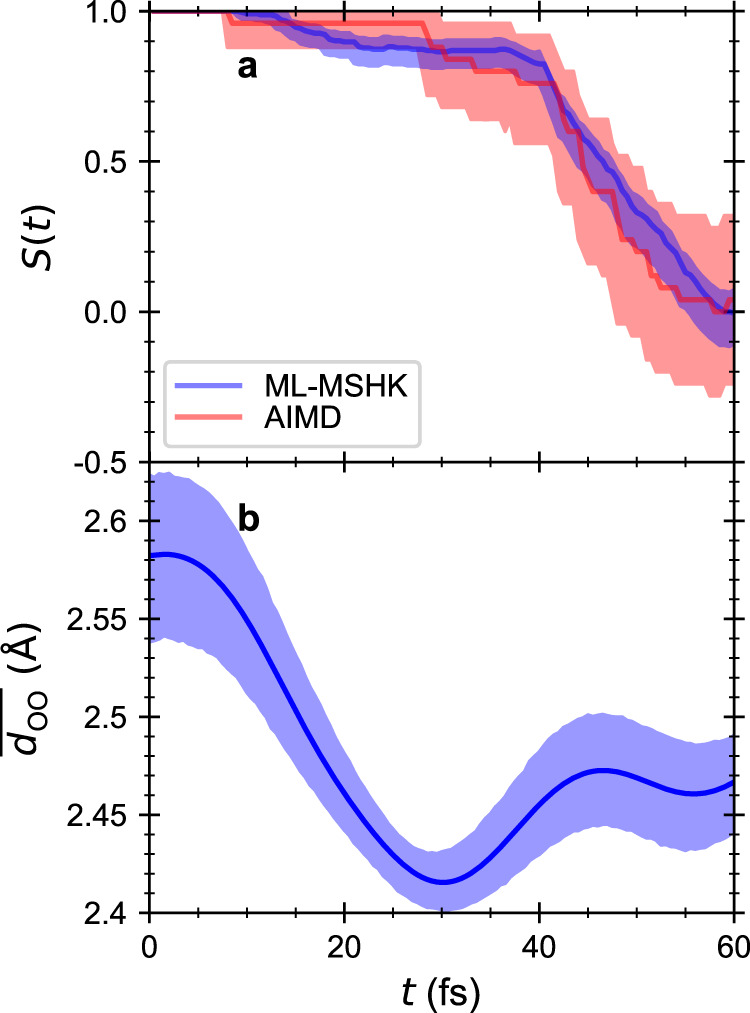
Fig. 4. The non-equilibrium response of the excited-state proton transfer reaction and its relationship to the time varying oxygen–oxygen distance of MA.

a Non-equilibrium response function of the proton’s location (reactant or product basin according to Eq. (3)), S(t), that reflects the progress of the excited-state proton transfer reaction. The solid curves are the expectation values of S(t) and the shaded area shows the 95% confidence intervals estimated from bootstrap analysis using 50 trajectories for ab initio molecular dynamics (AIMD) (red) and 1000 trajectories (blue) for ML-MSHK. The converged S(t) of the ML-MSHK model shows good agreement with the result from AIMD simulations. b The average oxygen–oxygen distance is shown as a function of time following photoexcitation.
