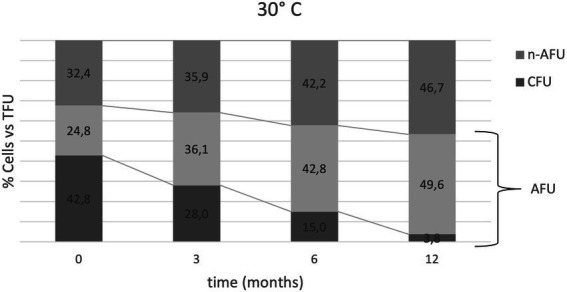
Figure 3.

Bacterial heterogeneity distribution over time at 30°C expressed as the % of cells (CFU, AFU and n-AFU) vs. TFU (100% of the population at each time point). Relative % of AFU is the sum of AFU + CFU values; for example, t0 is represented by 42.8% CFU vs. TFU, 67.6% AFU vs. TFU and 32.4% n-AFU vs. TFU. First line from the top is representative of the AFU trend vs. time. Second line from the top is representative of CFU trends vs. time.
