Figure 6.

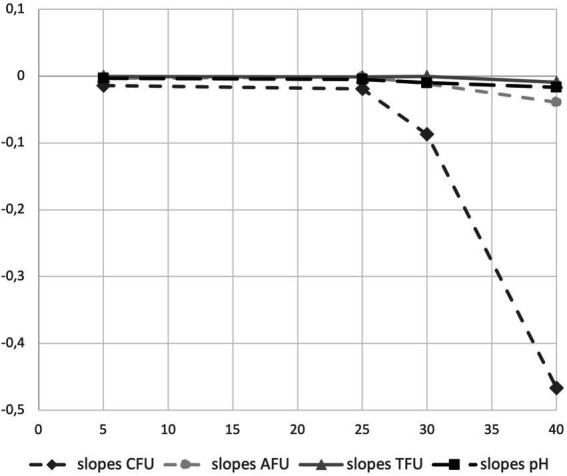
Graphical representation of acidification and enumeration (CFU, AFU and TFU) slopes obtained on clinical batch sample of synbiotic formula (PDS-08) after 12 months of storage at different temperature (5, 25, 30 and 40°C).

Graphical representation of acidification and enumeration (CFU, AFU and TFU) slopes obtained on clinical batch sample of synbiotic formula (PDS-08) after 12 months of storage at different temperature (5, 25, 30 and 40°C).