
FIGURE 4.
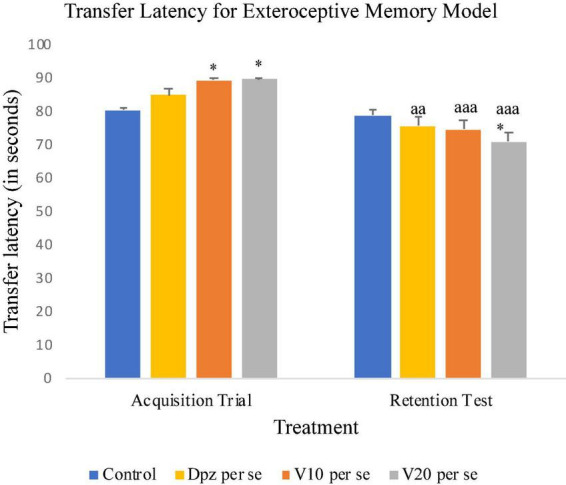
Effect of vanillin and other treatments on transfer latency. Data are expressed as mean ± SEM. “*” denotes P < 0.05 with respect to the control group within the same day. “aaa” denotes P < 0.001 with respect to the TL of the same group on the 10th day of the treatment, and “aa” denotes P < 0.01 with respect to the TL of the same group on the 10th day of the treatment.