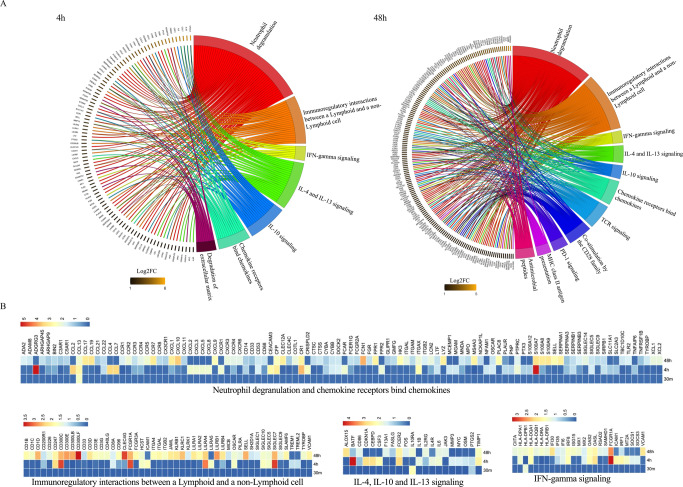
Fig. 4. Pathway analysis resulting from Aedes aegypti mosquito bites over time.
A Chord plot shows significantly upregulated genes at 4 h and 48 h post-bite over NSK (left side of chord plot) and overrepresented pathways (right side of chord plot). Outer left ring shows genes and color range displays log2 fold change (FC) (left, key at bottom) or Reactome terms (outer right ring). Chords connect gene names with Reactome term pathways. B Heatmap (scaled to log2FC) displaying a list of DEGs based on the common pathways overrepresented at 4 and 48 h post-bite.

