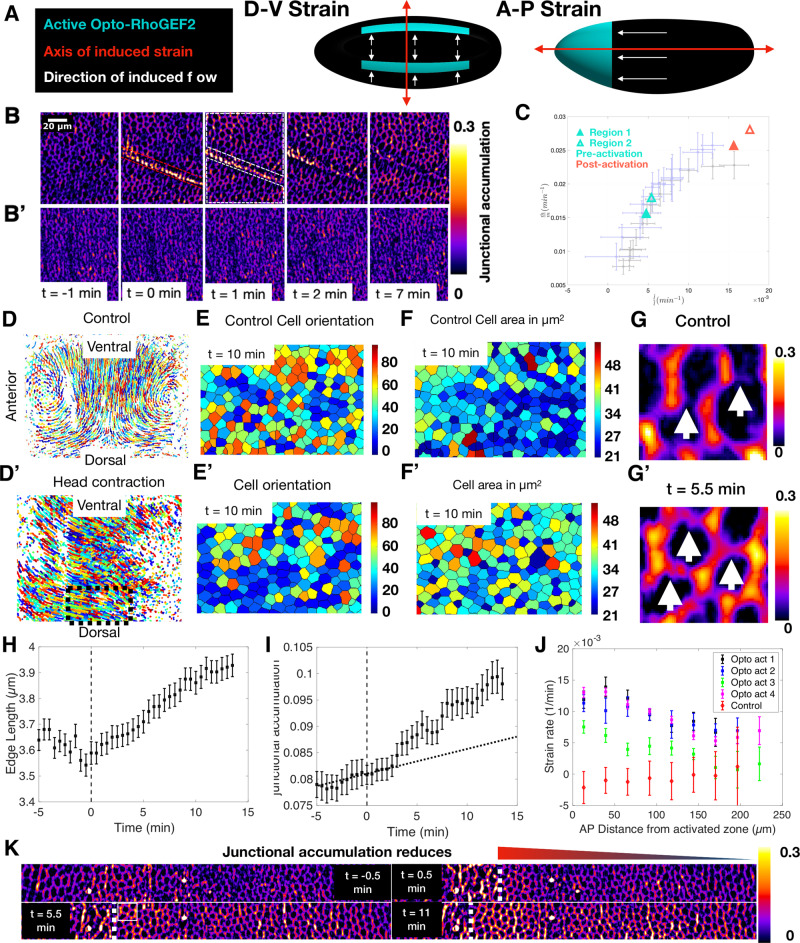
Fig. 2. Patterned contractility by optogenetics redirects flows.
A Schematic of optogenetic strategy to generate strain parallel to the DV axis (left) or AP axis (right). Cyan indicates the area(s) of transient optogenetic activation; black regions are not activated. B JMA in an activated embryo (as in A, left). t = 0 corresponds to the first image after activation (~5 min post CF formation). Red dashed lines designate the activated regions. B′ JMA in a control embryo in an equivalent region and developmental stage as that in B. C Myosin and strain rate for two regions of an activated embryo (Fig. S4A′) before (cyan) and after (magenta) activation plotted over control data (from Fig. 1I). D, D′ Cell trajectories in one lateral side (Fig. S1J) of a control (D) and activated (D′) embryo for 15 min beginning 5 min after CF formation (first time point following activation in the opto exp). The Black dashed box designates the region analyzed in (E, F′). E, E′ Cells color-coded by orientation (angle between cell long axis and AP axis) in control (E) and activated (E′) embryos. F, F′ Cells color coded for apical cell area in control (F) and activated (F′) embryos. Area distributions are significantly different (Two-sided ks test, p = 1.2 × 10⁻⁹). G, G′ JMA in equivalent regions of control (G) and activated (G′) embryos of equivalent developmental time (See K). White arrows identify junctions parallel to the AP axis. H, I Length (H) and JMA (I) over time of junctions parallel to the AP axis in an activated embryo. The Gray dashed line shows the time of activation. Data were mean SD, n 200 junctions. I Black dashed line shows JMA expected without activation from the slope of pre-activation data. J Strain rate on junctions parallel to the AP axis measured across the entire embryo (excluding the 50-micron region about the ventral midline) as a function of distance from head activation along the AP axis. Data were mean SD, n 200 junctions. K JMA in a lateral region spanning the AP axis of a head activation experiment. The White dashed line shows the boundary between activated (left) and unactivated (right) cells. The white solid outline shows an area corresponding to G. Triangle represents the gradation of JMA along the AP axis. t = 0 is first time point after activation, ~0 min post CF formation. H–J Source data are provided as a Source Data file.

