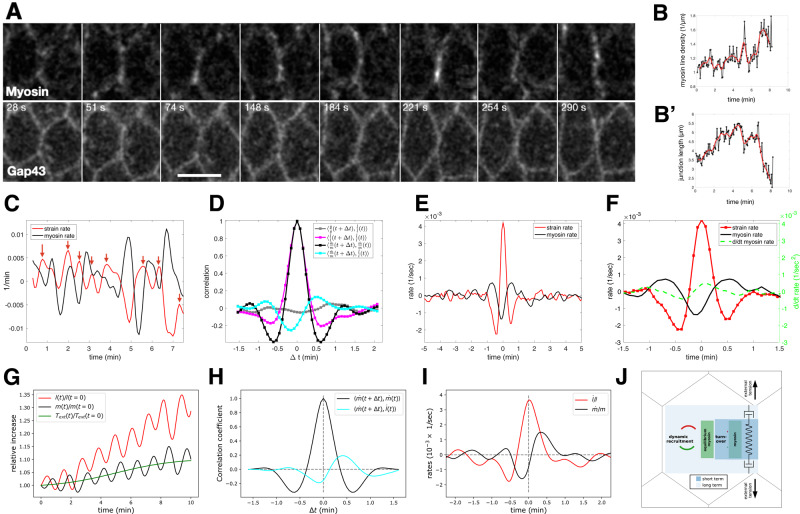
Fig. 4. Single-edge analysis and modeling of myosin and membrane dynamics.
A Confocal images of cells during early gastrulation marked with sqh::GFP and Gap43::mCherry showing time points that highlight the oscillations of myosin and junction length. The scale bar is 5 microns. Representative images are shown from one of eight similar movies. B Myosin line density normalized to initial myosin line density over time of data shown in panel (A). B′ Junction length in microns over time. In both (B, B′), black points represent data. The red line is a gaussian smoothed representation of the raw data points. Sigma = 10 s. C Plot of strain rate (red) and myosin rate (black) over time calculated from the data plotted in (B, B′). Red arrows indicate peaks in strain rate. D Autocorrelation analysis of strain rate (red) and myosin rate (black) and cross-correlation analysis of membrane rate with strain rate (gray) and myosin rate with strain rate (green). E Traces were obtained by aligning strain rate peaks and averaging the aligned strain rate (red) and myosin rate (black). F Same as in E, with displayed data corresponding only to one cycle before and after t = 0 and with the myosin acceleration plotted on the same graph (green dashed line). D–F include n = 175 bonds. Similar results have been obtained across five embryos. G Sample simulation of the relative increase in junction length (red) and myosin concentration (black) over time given by the model. External tension is applied to the junction shown in green. H Autocorrelation analysis of myosin rate (black) and cross-correlation of myosin rate with strain rate (green), based on N = 500 model simulation runs. I Average curves of strain rate (red) and myosin rate (black) predicted by the model after strain rate peak alignment, as in E (N = 500). J Cartoon representation of the dilution oscillator model with mechanical feedback. C–I Source data are provided as a Source Data file.

