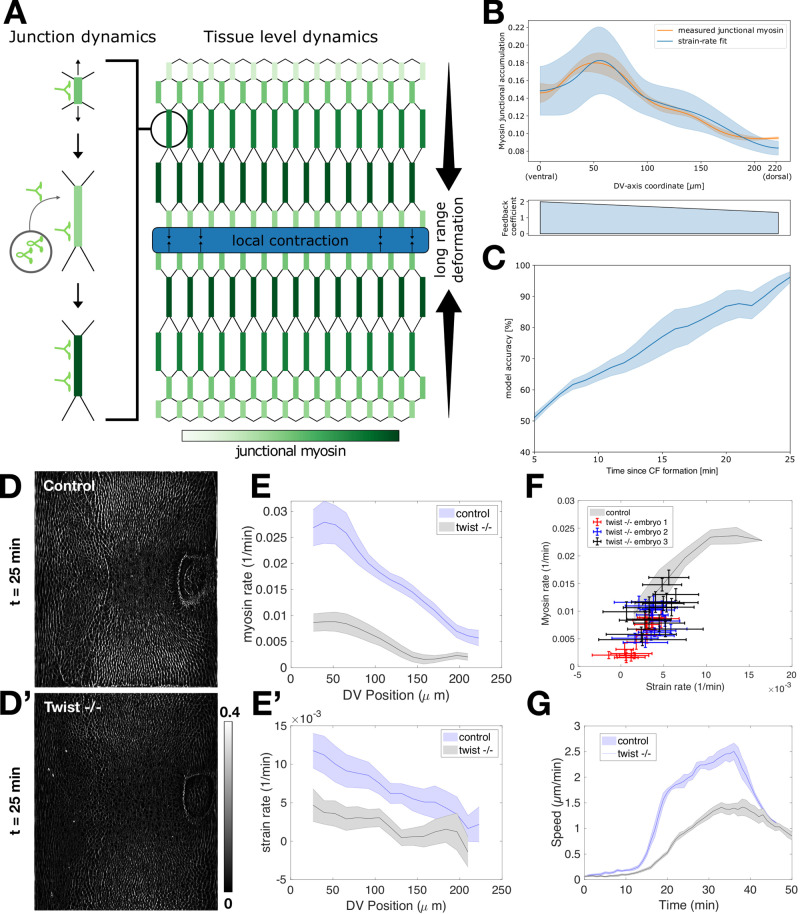
Fig. 5. Prediction of embryo-scale myosin distribution from junctional model and analysis of twist mutant embryos.
A Illustration connecting junctional dynamics (left) with tissue-scale dynamics (right). Local contraction propagates across the tissue as long-range deformations, which serve as the source of external tension activating mechanical feedback for myosin recruitment and establishing tissue-scale gradients of junctional myosin accumulation. B Comparison of measured junctional myosin levels (orange) and myosin levels predicted from the model using total strain as input (blue). The lower plot shows the DV gradient of the feedback coefficient input into the model. Error bars give the standard deviation of model output (i.e. (total strain)^ feedback coefficient) over tracked junctions. C Model accuracy over time, representing the level of agreement between predicted and measured myosin profiles. D, D′ Junctional myosin accumulation in twist heterozygous (“control”, D) and twist homozygous (“Twist −/−”, D′) embryos at equivalent times. The lookup table is the same for D, D′. E Myosin rate as a function of DV position in control (blue) and twist (black) embryos. E′ Strain rate as a function of DV position for control (blue) and twist (black) embryos. F Strain rate vs myosin rate plot with the average wild-type curve (blue) and individual twist embryos (points). G Mean velocity over time for wildtype and twist mutant embryos. t = 0 corresponds to the onset of CF formation. In all cases, error bars indicate standard deviation, unless otherwise stated. B, C, E–G Source data are provided as a Source Data file.

