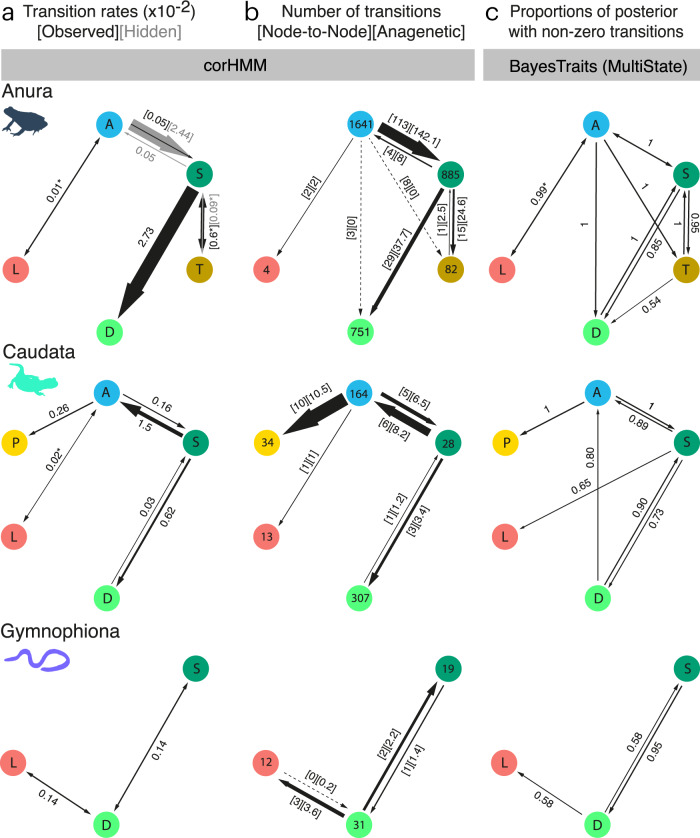
Fig. 3. Estimated rates, frequencies and posterior sampling of reproductive-mode transitions in each major amphibian group.
a Estimated transition rates (×10−2) from best-performing corHMM models. Gray arrows and annotations represent hidden state rates. Rates lower than 0.01 are not shown. The best models for Anura and Caudata allowed for all rates to be different (except for pairs of rates annotated with an asterisk that have been forced to be symmetrical; see Methods), and the model for Gymnophiona had all rates set to be equal. b Numbers of transitions when estimating ancestral states at nodes only using joint estimations [Node-to-Node] and the mean numbers of transitions along branches [Anagenetic], estimated from 1000 stochastic character maps. Dashed lines indicate transitions only recovered using one of the two methods. The number of species per reproductive mode represented in the phylogeny are indicated in the nodes of the networks. c Proportions of models in the posterior where a given transition was estimated (i.e., non-zero transition rate) by the reverse jump MCMC of the MultiState Covarion algorithm implemented in BayesTraits. Proportions of 1 indicate transitions that were present in all models sampled by the MCMC. Transitions with proportions <0.5 are not shown. In all cases, color, position and letters of nodes are consistent and represent A, blue = aquatic; S, dark green = semi-terrestrial; T, brown = terrestrial; D, light green = direct development; L red = live-bearing; P, yellow = paedomorphism. Arrow weight is roughly proportional to transition rates (not to scale). Icons for each panel row distinguish the three amphibian groups. Source data are provided as a Source Data file.

