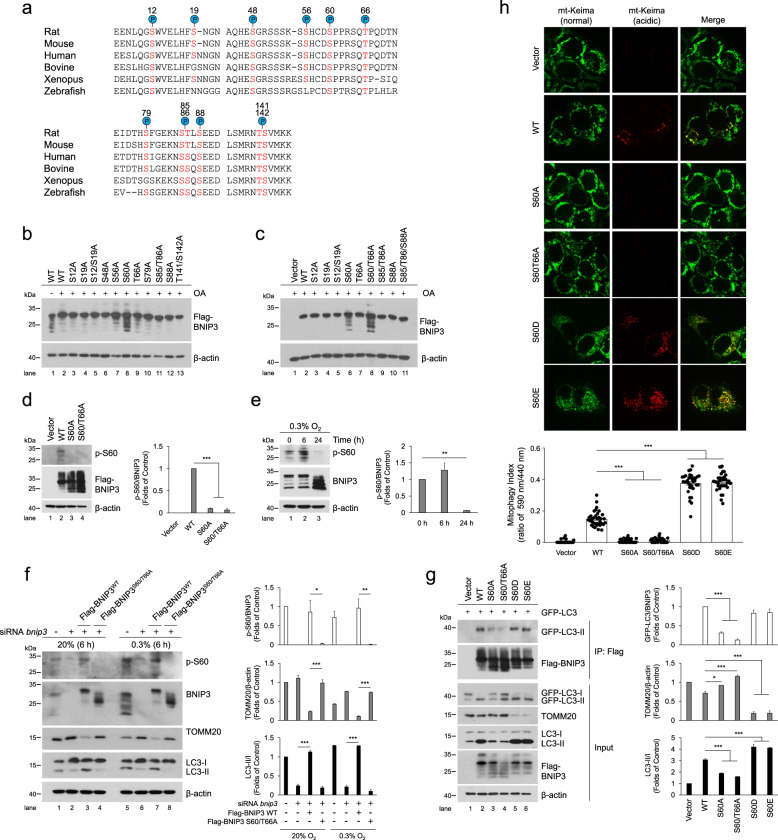
Fig. 2. Phosphorylation of BNIP3 at S60/T66 is critical to promote mitophagy by enhancing its interaction with LC3.
a Putative BNIP3 phosphorylation sites based on reported proteomics data (PhosphoSitePlus®) that are conserved across different species. Conserved serine and threonine residues are marked in red. b, c HeLa cells were transfected with empty vector and Flag-BNIP3 plasmids encoding either wild-type (WT) or mutant BNIP3 constructs generated via site-directed mutagenesis. After 48 h of transfection, cell lysates were detected via western blotting with anti-Flag antibody. OA, okadaic acid. d HeLa cells were transfected with empty vector, WT, S60A or S60/T66A mutant Flag-BNIP3 plasmids, phosphorylation of BNIP3 was detected via western blotting using a phospho-specific antibody against BNIP3 at Ser 60 (p-S60). n = 3. e The phosphorylation level of BNIP3 at Ser 60 in PC12 cells was measured under 0.3% O2 for the indicated time. n = 3. f PC12 cells were treated with Bnip3 siRNA and transfected with Bnip3 siRNA-resistant WT or S60/T66A plasmids, and then cells were exposed to 20% O2 or 0.3% O2 for 6 h, respectively. Mitophagy and the phosphorylation of BNIP3 were detected via western blotting. n = 3. g HeLa cells were transfected with GFP-LC3 and empty vector, WT or the indicated Flag-BNIP3 mutants for 48 h. Cell lysates were immunoprecipitated with anti-Flag antibody and then subjected to western blot analysis with the indicated protein antibodies. n = 3. h The indicated plasmids were transfected into HeLa cells stably expressing mt-Keima and cell images were captured with a confocal microscope. Mitophagy was identified and quantified by the ratio of acidic (590 nm, red) to normal mitochondria (440 nm, green). Scale bar, 10 μm. n = 35. The data are expressed as means ± SEM. *P < 0.05, **P < 0.01, ***P < 0.001 versus the indicated group.

