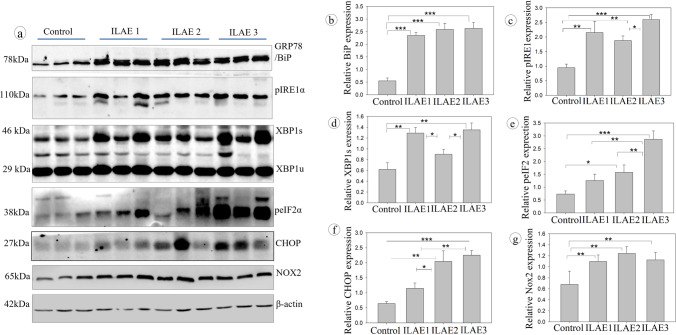
Fig. 3.
Western blot analysis of ER stress response in FCD patient samples: Immunoblot assay for ER stress: Bip/GRP78, p-IRE1α, XBP1, p-eIF2 α, CHOP, NOX2, and β-actin in control and epileptic patient resected brain samples. An equal amount of protein was loaded in SDS-PAGE and transferred onto NC membranes, then blocked with nonfat milk and probed with primary antibody. The lane represents the control and FCD (n = 3). The band/signal intensity was quantified (Relative protein expression) and shown as mean ± SEM. Densitometry analysis (b–g) showed a significant increase in BiP/GRP78, p-IRE1α, XBP1, p-eIF2 α, CHOP, and Nox2 in the FCD samples belonging to ILAE classes 2 and 3 than class 1 and controls. *P < 0.05, **P < 0.01, ***P < 0.001

