Fig. 4.
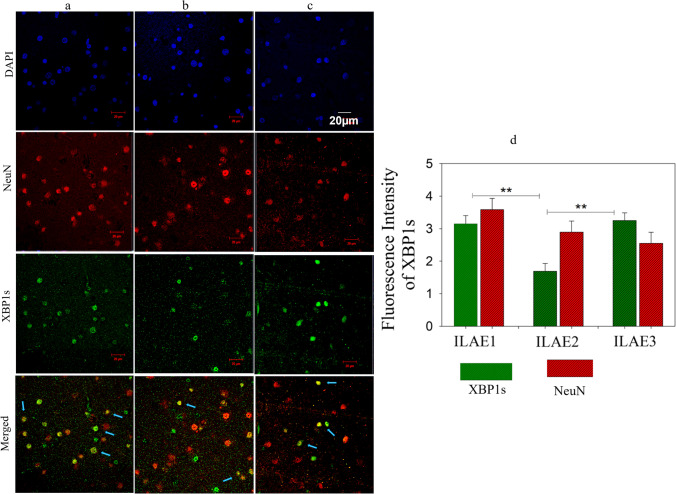
Double immunofluorescence study for XBP1 expression in FCD (colored image). Double immunofluorescence assay. Staining of XBP1s (green) and NeuN (red) a, b, and c represents the neuronal expression of XBP1s in ILAE outcome classes 1, 2, and 3 of FCD patient’s brain sections (n = 3), respectively. The blue color represents di-amidino phenylindole (DAPI) staining used as a nuclear counterstain. The arrowheads in the merged image of NeuN + XBP1s represent the localization of XBP1s in neuronal cells. The fluorescence intensity of XBP1s was quantified and shown as mean ± SEM. Class 1 (a) > Class 2 (b) < Class 3 (c). Scale bar = 20 µm. Data is representative of 3 independent experiments

