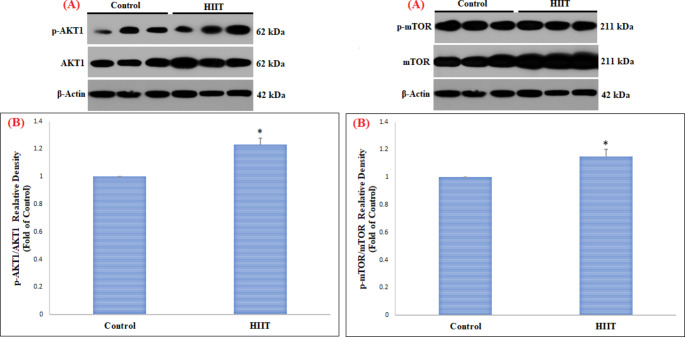
Fig. 1.
Comparison of the contents of pAKT1 ser473 /AKT1 and pmTOR ser2448 /mTOR proteins in FHL skeletal muscle among the control and HIIT groups
(A) Western blotting of pAKT1ser473/AKT1 and pmTORser2448/mTOR proteins, with β-actin as an internal control in FHL skeletal muscle tissue
(B) The column graph (mean and standard deviation) represents the quantity of pAKT1ser473/AKT1 and pmTORser2448/mTOR protein levels versus internal control (β-actin), which are presented after the normalization against the control group. (*indicating a significant difference between 8 weeks of HIIT training compared to the control group)

