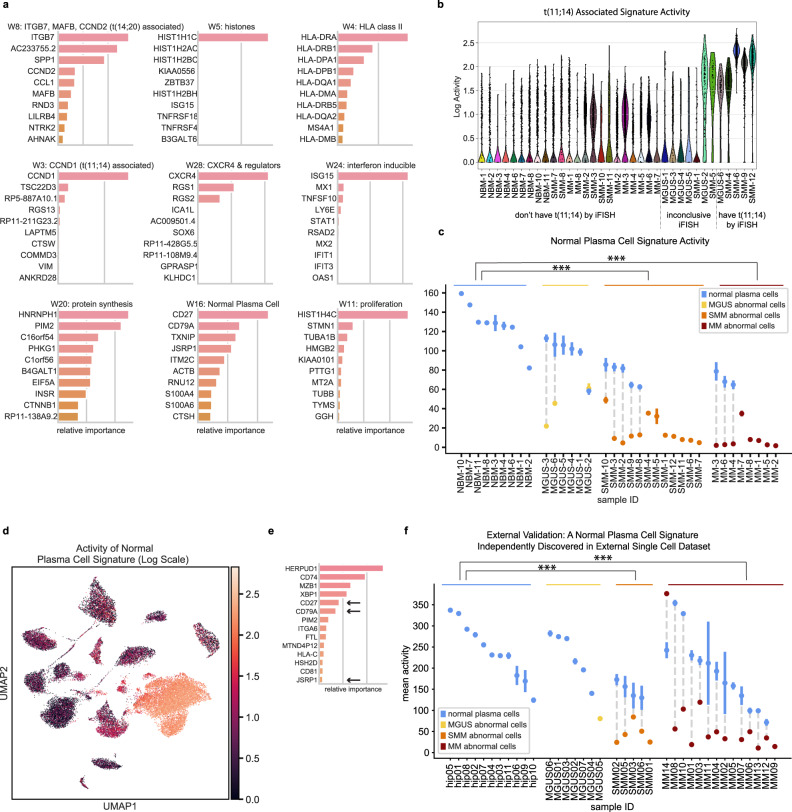
Fig. 3. Bayesian non-negative matrix factorization uncovers gene signatures which capture myeloma cell biology across disease stages.
a Top genes for nine representative gene signatures. The importance score, plotted on the x-axis, is based on both the strength of the gene’s contribution to the signature and its specificity to the signature (see Methods). b A signature with top contribution from CCND1 is discovered and is most active in samples with t(11;14), as expected. c, d We discover a ‘normal plasma cell signature’ that is active in normal plasma cells across disease stages and downregulated in abnormal cells from MM and precursor conditions. We visualize this signature’s activity by showing its mean activity ± s.e.m. for the normal and abnormal populations within each sample (c) and on a UMAP plot (log scale) (d). Mean activities were compared between groups, with *** denoting q < 0.001 for group differences (abnormal cells from SMM (n = 12) and MM (n = 8), respectively, significantly differed from NBM (n = 9)). e Validation on external dataset: our NMF algorithm run on external CD138+ single cell data from MGUS, SMM, MM and healthy donors independently discovers a gene signature similar to our normal plasma cell signature, with shared top genes CD27, CD79A, and JSRP1. f After labeling cells in that dataset as normal or abnormal, we discover that this signature follows the same pattern as in our data, with high activity in normal cells and a significant decrease in activity in abnormal cells across disease stages. Mean activities ± s.e.m. across cells in normal and abnormal portions of samples are shown, with *** denoting q < 0.001 for group differences (abnormal cells from SMM (n = 5) and MM (n = 13), respectively, significantly differed from NBM (n = 11)). Source data are provided as a Source Data File.

