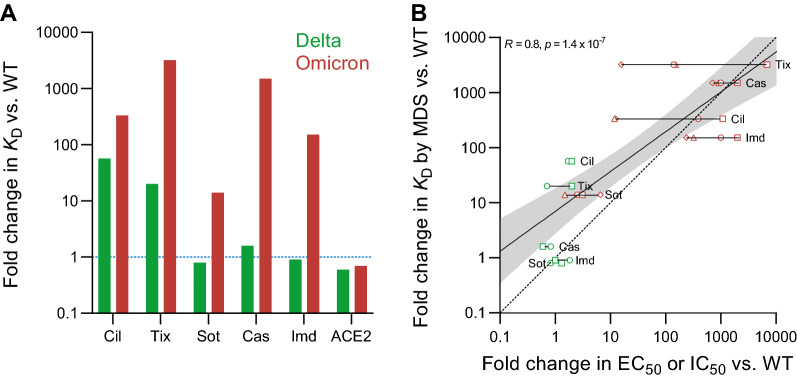
Figure 3.
(A) Affinity (KD) changes of therapeutic COVID-19 antibodies and ACE2 in the presence of Delta (green) and Omicron BA.1 (red) spike RBDs as compared with wild type RBD. (B) KD changes of therapeutic COVID-19 antibodies correlated with their published half-maximal effective concentrations (EC50) or half-maximal inhibitory concentrations (IC50) of focus reduction neutralization tests (FRNT; active virus) or pseudovirus neutralization tests (PNT), respectively. Triangles and diamonds are FRNTs using VERO-TMPRSS2 and VERO-hACE2-TMPRSS2 cells, respectively, taken from VanBlargan et al.7. Squares and circles are PNTs taken from Cao et al.5 and Liu et al.6, respectively. The solid line is a linear regression with the gray area indicating the 95% confidence intervals, R the Pearson’s correlation coefficient and the p-value demonstrating statistical significance. The dashed line indicates the ideal scenario of change in KD being equal to change in EC50 or IC50.

