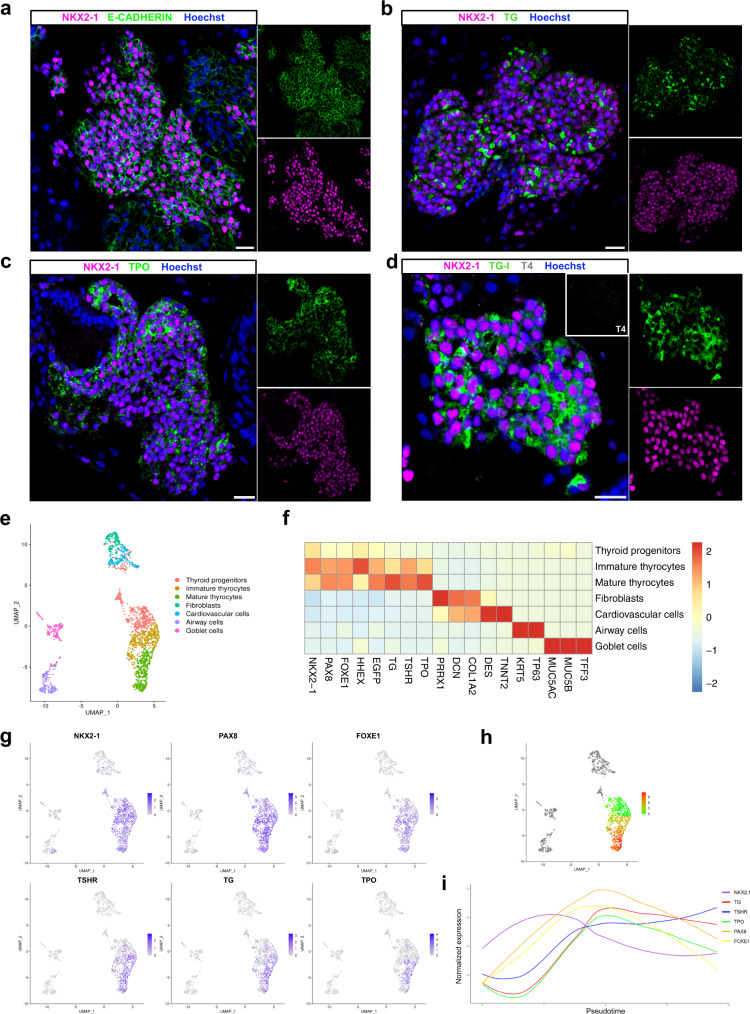
Fig. 2. Immunostaining and Single-cell RNA-seq characterization of human ESC-derived thyroid cells at day 45.
a–d Confocal immunofluorescence images of the three-dimensional follicular structures co-expressing NKX2-1 and (a) E-CADHERIN, (b) TG, (c) TPO (d) TG-I storage in the lumenal compartment. e Single-cell RNA-Seq unsupervised clustering of in vitro hESC-derived human thyroid organoid model cells. Each cluster is represented by a specific color. f Heatmap showing normalized expression of selected marker genes with rows representing cell clusters, while columns represent genes. The intensity of the color in each square indicates the mean expression within the cluster. g UMAP overlaid with gene expression plots for thyrocyte markers. Color indicates normalized expression. h Diffusion analysis of thyrocyte lineage with thyroid progenitor cells as root cells. UMAP overlaid with pseudotime. Color in pseudotime plot indicates order of cell progression. i Expression trends of thyroid genes along the pseudotime trajectory. The experiment was performed at least three times with similar results (a–d). a–d Scale bars, 20 μm.

