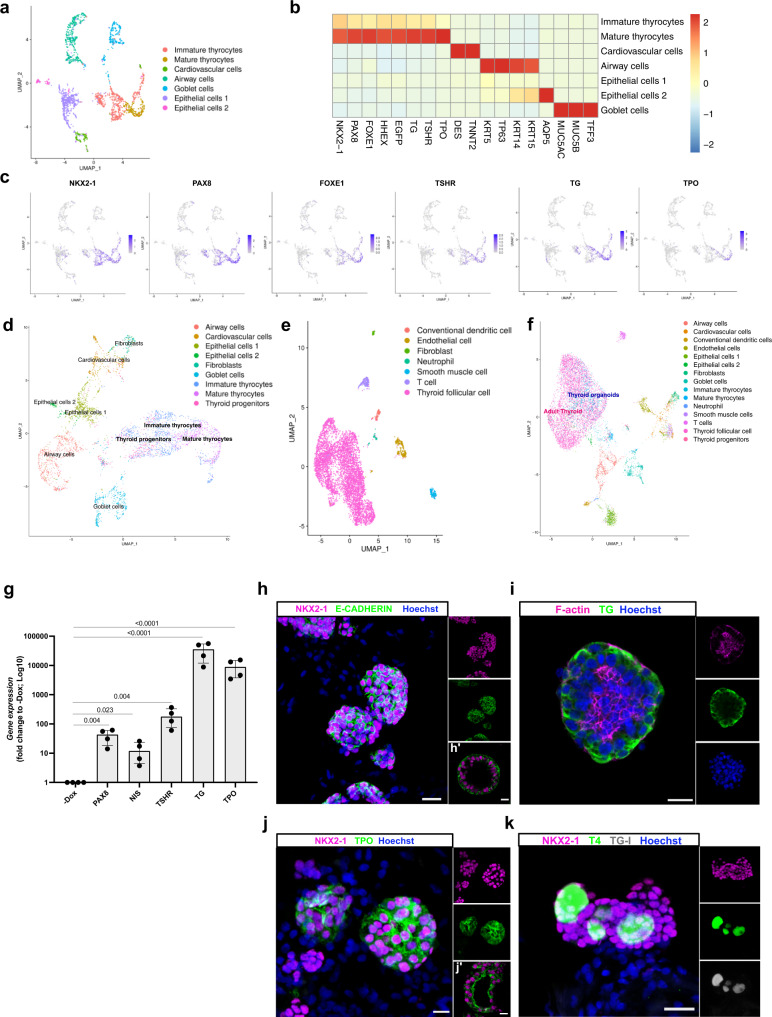
Fig. 3. Single-cell RNA-seq and immunostaining characterization of human ESC-derived thyroid cells at day 58.
a Single-cell RNA-Seq unsupervised clustering of in vitro hESC-derived human thyroid organoid model cells. Each cluster is represented by a specific color. b Heatmap showing normalized expression of selected marker genes with rows representing cell clusters, while columns represent genes. The intensity of the color in each square indicates the mean expression within the cluster. c UMAP overlaid with gene expression plots for thyrocyte markers. Color indicates normalized expression. d UMAP showing integration analysis of single-cell RNA-seq data from thyroid organoids at day 45 and 58. e Single-cell RNA-Seq unsupervised clustering of publicly available human adult thyroid tissue dataset. Each cluster is represented by a specific color. f UMAP showing integration analysis of single-cell RNA-seq data from human adult thyroid tissue and hESC-derived thyroid organoids at days 45 and 58. g qRT-PCR analysis of PAX8, NIS, TSHR, TG, and TPO at thyroid organoids from day 58 of differentiation protocol compared to un-induced control (−Dox) (n = 4). h–k Confocal immunofluorescence images at day 58 of the differentiation protocol. h Three-dimensional follicular structures co-expressing NKX2-1 and E-CADHERIN. i Intra-lumenal F-actin (Phalloidin) and TG; (j) NKX2-1 cells with TPO cytoplasmic and apical membrane accumulation. k NKX2-1 cells showing TG-I and T4 stored in the lumenal compartment. Data from at least three independent experiments are shown. Statistical analyses were performed using two-sided unpaired Mann–Whitney (p values are presented in the graphs; data presented as median (IQR)). The experiment was performed at least three times with similar results (h–k). Scale bars, 20 μm and 10 μm for high magnification follicles. Source data are provided as a Source Data file.

