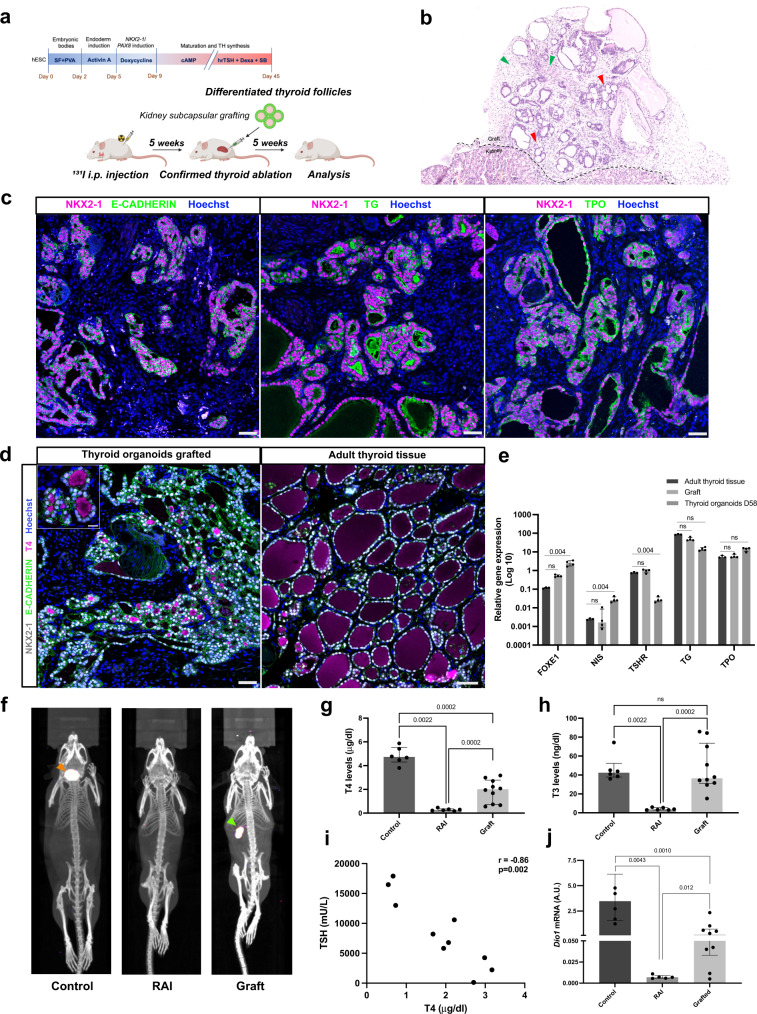
Fig. 4. In vivo functionality of transplanted human ESC-derived thyroid follicles.
a Schematic representation of the hESC-derived thyroid organoids transplantation protocol under the kidney capsule of NOD-SCID thyroid RAI-ablated mice. b, c Histological analysis of the grafted tissue 5 weeks after transplantation. b Hematoxylin and eosin staining shows human thyroid follicles located in the cortical region of the host kidney. Red arrows show the monolayer epithelium of the transplanted tissue surrounded by stromal cells (green arrows). c Confocal images show co-expression of NKX2-1 and E-CADHERIN in the monolayered follicles. The grafted tissue shows TG mainly accumulated in the luminal compartment, whereas TPO is strongly expressed in the apical membrane. d NKX2-1, E-CADHERIN and T4 immunostaining demonstrate hESC-derived follicles with specific accumulation of T4 within the lumen of several structures as observed in human adult thyroid tissue. e qRT-PCR analysis of FOXE1, NIS, TSHR, TG and TPO expression from human adult thyroid tissue sample compared to graft tissue and/or hESC-derived thyroid cells from day 58 (normalized by PAX8 levels; n = 3, 4 and 4, respectively). f Maximum intensity projections generated from SPEC/CT images of controls (left), RAI-ablated and non-transplanted (middle), and RAI-ablated and transplanted (right) mice. Images were obtained four weeks after organoids transplantation. The 123I uptake in the mouse thyroid tissue is shown by the orange arrow, while the signal from the human thyroid tissue (graft) is highlighted by the green arrow. g, h Plasma levels of (g) T4 and (h) T3 in controls (n = 6), RAI-ablated (RAI; n = 6) and RAI-ablated/grafted mice (graft; n = 10). i Correlation of plasma TSH and T4 levels among grafted animals (n = 10). j Comparison of hepatic Dio1 mRNA levels in controls (n = 6), RAI-ablated (n = 6) and RAI-ablated/transplanted mice (n = 10). All measurements were performed five weeks after transplantation. Two-sided unpaired Mann–Whitney (g, h, j) and Spearman Correlation (i) tests were used for statistical analysis (r and p values are presented in the graphs; ns not significant; data are presented as median (IQR)). Similar results were obtained from all grafted samples (c, d). Scale bars, 50 μm and 20 μm for zoomed area. Source data are provided as a Source Data file.

