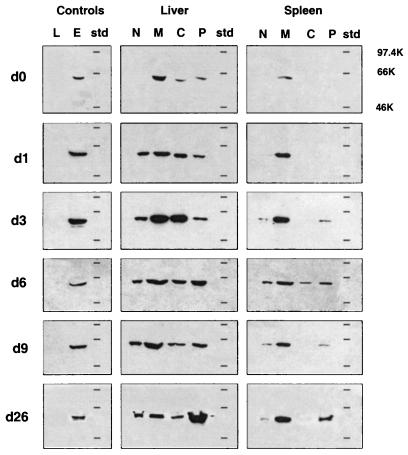
FIG. 3.
Subcellular distribution of hsp60 in vivo during infection. Spleen and liver cells from mice at various times (days [d]) after infection with L. monocytogenes (0.34 LD50) were fractionated, and 15 μg of protein from the nuclear (N), mitochondrial (M), cytoplasm (C), and plasma membrane (P) fractions were analyzed for hsp60 expression by Western blotting. Molecular weight markers (std) and total cell lysates of L. monocytogenes (20 μg; L) and EL4 (15 μg; E) were included on each gel. The results shown are representative of those obtained in three independent experiments. The horizontal lines on each blot represent positions of molecular weight standards (97.4, 66, and 46 kDa).

