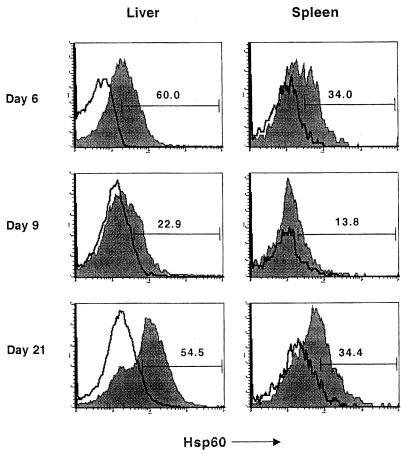
FIG. 5.
Increased hsp60 expression on macrophages in livers and spleens of infected mice. Spleen and liver cells obtained from mice at various times after infection were analyzed by flow cytometry. hsp60 expression by monocytes/macrophages was determined by gating on Mac-1+ cells and analyzing for hsp60 expression. The filled and open plots show profiles of staining obtained with anti-hsp60 (filled profiles) and an isotype-matched antibody, respectively; numbers represent percentages of Mac-1+ cells which are hsp60+.

