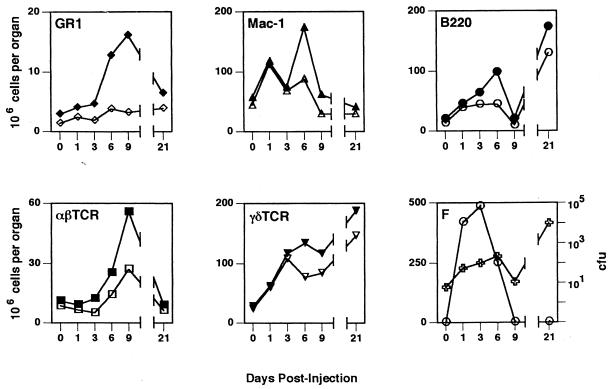
FIG. 6.
Kinetic profiles of cellular response, hsp60 expression, and bacteria in the liver. Before and at various times after infection with L. monocytogenes (0.30 LD50), the numbers of granulocytes (GR1), monocytes/macrophages (Mac-1), B cells (B220), αβ T cells (αβTcR) and γδ T cells (γδTcR) present in the liver were determined from total cell counts, and the proportion of cells reactive with lineage-specific antibodies as determined by flow cytometry. Closed symbols, total cell numbers; open symbols, numbers of hsp60+ cells of each cell subtype. Panel F shows the bacterial CFU (○) and total number of surface hsp60+ cells (✙). All values are means from four animals. Standard deviations were <20% in all cases and for the sake of clarity are not shown.

