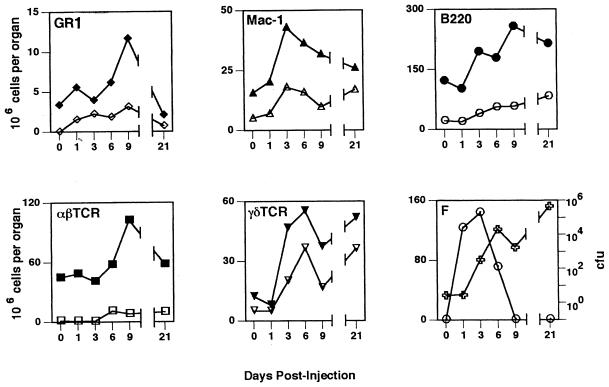
FIG. 7.
Kinetic profiles of the cellular response, hsp60 expression, and bacteria in the spleen. Spleen cells were analyzed and the different populations were enumerated as described in the legend to Fig. 6. Closed symbols, total cell numbers; open symbols, numbers of hsp60+ cells of each cell subtype. Panel F shows bacterial CFU (○) and total number of surface hsp60+ cells (✙). All values are means from four animals. Standard deviations were <20% in all cases and for the sake of clarity are not shown.

