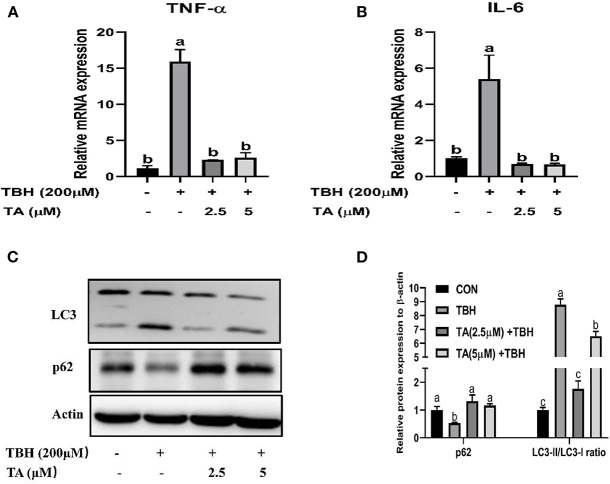
Figure 8.
Effects of tannic acid (TA) on the inflammatory cytokines and autophagy of IPEC-J2 cells. The mRNA expression of TNF-α (A) and IL-6 (B). Western blotting analysis of the protein expression of LC3 and p62 is shown (C). Quantitative analysis of the protein expression of LC3 and p62 (D). Data are presented as mean ± SEM, n = 3. TA, tannic acid; TBH, tert-butyl hydroperoxide. a, bvalues in the same row not sharing a common superscript differ significantly.

