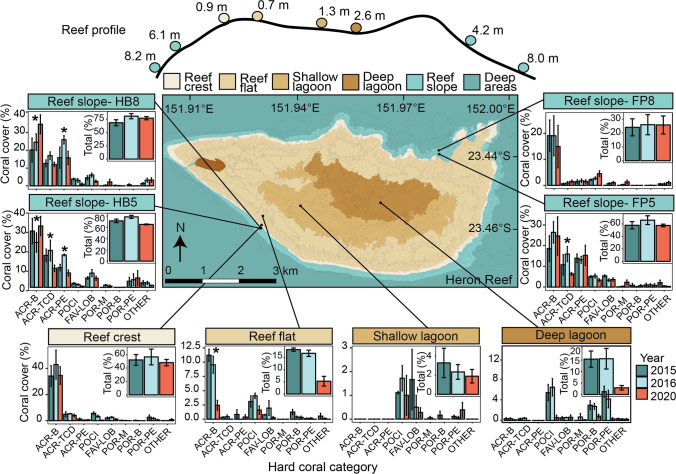
Fig. 1.
Hard coral abundance by site and year across Heron Reef. Cross section of Heron Reef indicating each site and mean depth (m). Map shading represents geomorphological habitats, redrawn from the data of Phinn et al. 2012. Hard coral cover is displayed by functional group, with inset showing total coral cover (% ± SE; n = 3). Asterisks (*) indicate where there are significant (p < 0.05) differences within categories. ACR-B, Acroporidae- branching; ARC-TCD, Acroporidae- tabular/corymbose/digitate; ACR-PE, Acroporidae- plating/encrusting; POCI, Pocilloporidae; FAV-LOB, Faviidae-Lobophyllidae; POR-M, Poritidae-massive; POR-B, Poritidae-branching; POR-PE, Poritidae-encrusting/plating varieties; and OTHER, other hard corals (including non-scleractinian corals)

