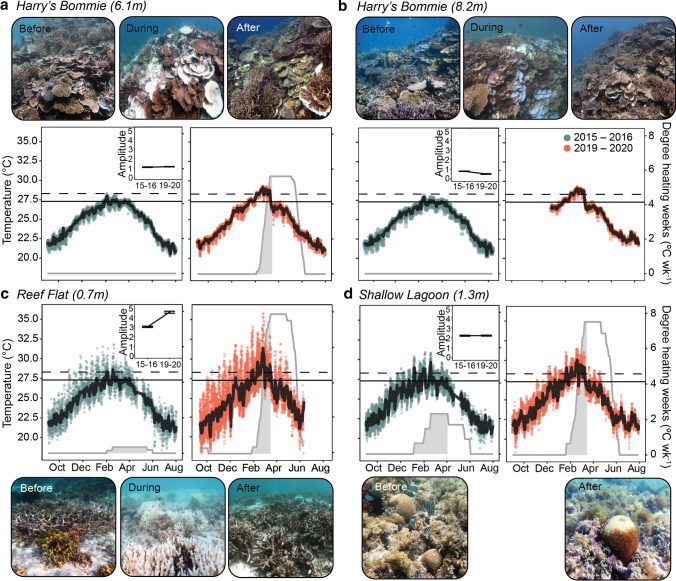
Fig. 2.
Temperature profiles and representative images from thermally stable and thermally variable habitats across Heron Reef. Images show coral communities before thermal stress (November 2015), during the peak of the marine heatwave (March 2020) and five months after the marine heatwave (August 2020). In situ temperature profiles and heat stress accumulation recorded from September 2015–August 2016 and September 2019–August 2020 at four sites across Heron Reef: (A) Thermally stable reef slope at 5 m depth (Harry’s Bommie 5 m), (B) thermally stable reef slope 8 m depth (Harry’s Bommie 8 m), (C) thermally variable reef flat and (D) thermally variable shallow lagoon. Points indicate hourly measurements and solid black lines indicate mean daily temperatures. Heat stress accumulation (gray shading) was estimated by degree heating weeks (solid gray line) calculated from mean daily temperatures. Degree heating weeks were not calculated for (B) in 2019–2020 due to an incomplete record. Solid horizontal line indicates the region’s climatological maximum monthly mean (MMM; 27.3 °C) and dashed horizontal line indicates the region’s coral bleaching threshold (MMM + 1 °C; 28.3 °C). Insets show mean daily temperature amplitude (°C ± SE). Image credit: Before, After: Kristen Brown; During: Aaron Chai

