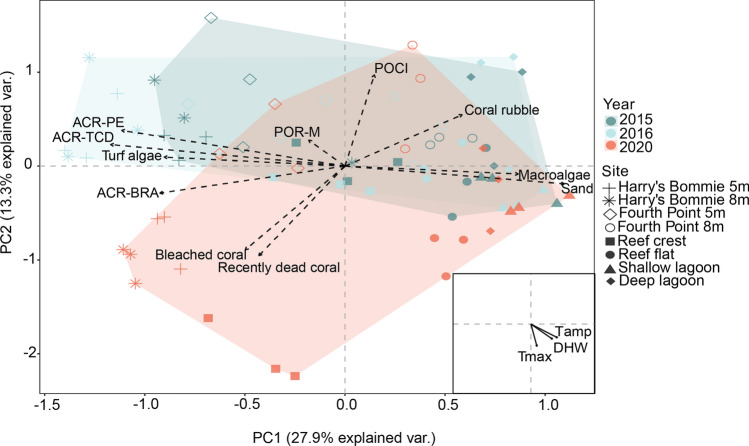
Fig. 3.
Principal components analysis (PCA) of benthic community composition by year. Convex hulls represent year groupings. Biplot vectors represent key benthic categories (dash-line arrows). Inset displays significant (p = 0.0001) temperature metrics (black arrows) according to squared correlation coefficients (r2). ARC-TCD, Acroporidae- tabular/corymbose/digitate; ACR-BRA, Acroporidae- branching; ACR-PE, Acroporidae- plating/encrusting; POCI, Pocilloporidae; POR-MASS, Poritidae-massive; DHW, Degree heating weeks; Tamp, Diel temperature amplitude; Tmax, Maximum temperature

