Abstract
Purpose
Photoreceptor loss plays a role in visual impairment in pathological myopia. As the nutrition and oxygen demands of photoreceptors are mainly supported by the choroidal vessels, we aimed to investigate changes in the choroidal vasculature and their correlations with visual acuity in pathological myopia.
Methods
The cohort was composed of 136 eyes from 80 participants, including 42 eyes from 21 participants with emmetropia/low myopia, 48 eyes from 26 participants with simple high myopia, and 46 eyes from 33 participants with pathological myopia. Swept-source optical coherence tomography (OCT) was used to image the eyes with a 12-mm radial line scan protocol. The parameters for 6-mm diameters of macula area centered on the fovea were analyzed. A custom deep learning algorithm based on a modified residual U-Net architecture was used to segment the choroidal boundaries. Then, the distance between the two boundaries was determined and choroidal thickness (CT), luminal area (LA), and stromal area (SA) were demarcated based on Niblack's auto-local threshold algorithm after binarization of the OCT images. Finally, the ratio of LA and total choroidal area was defined as the choroidal vascularity index (CVI). The choroidal parameters in three groups were compared, and correlations of the choroidal parameters with age, gender, axial length, and best-corrected visual acuity (BCVA) were analyzed.
Results
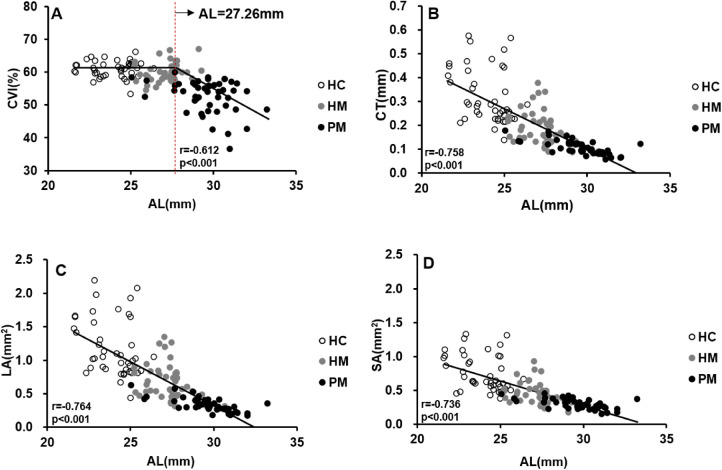
The CVI, CT, LA, and SA values were lower in pathological myopia than in emmetropia/low myopia and simple high myopia (P < 0.05). The CT, LA, and SA values were lower in simple high myopia than in emmetropia/low myopia (P < 0.05), whereas there was no difference between the CVIs in the emmetropia/low myopia and high myopia groups (P > 0.05). The CVI was nonlinear with increases in axial length (AL), and there was a critical AL flexion point, approximately 27.26 mm; however, the CT, LA, and SA were negatively correlated with AL. Further analysis showed that only younger subjects (40 years old or less) showed significant AL flexion points. Simple and multiple regression models showed that the CVI was correlated with BCVA (P < 0.05).
Conclusions
Choroidal vascular alterations, especially decreased CVI, occurred in patients with pathological myopia. The CVI decreased with axial elongation beyond the flexion point and was correlated with visual impairment, indicating that the CVI might be a reliable imaging biomarker to monitor the progression of pathological myopia.
Keywords: pathological myopia, visual acuity, choroid, choroidal vascularity index
The incidence of myopia is increasing significantly worldwide. Holden et al.1 predicted that 49.8% of the world population will have myopia and 9.8% will have high myopia (HM) by 2050. Moreover, Liu et al.2 documented that almost two-thirds of patients with highly myopic eyes developed pathological myopia (PM). Eyes with spherical equivalent (SE) ≤ −6.0 diopters (D) or axial length (AL) ≥ 26.5 mm with diffuse or severe atrophy were classified as PM, and 30.8% of patients with PM had a best-corrected visual acuity (BCVA) worse than 20/60. In general, incurable visual impairment and blindness resulting from PM are among the leading causes of vision problems worldwide. Therefore, it is essential to investigate the pathogenesis and risk factors of visual impairment in PM.
Although the exact mechanism that leads to macular pathology and visual impairment in PM is unknown, choroidal thinning has been widely considered as an important factor in vision loss during the development of PM. Histologic studies have shown choroidal degeneration in PM.3 Optical coherence tomography (OCT) has revealed thinning of the choroid with axial elongation in HM in vivo.3–16 Recently, changes in other choroidal vascular parameters, such as the choroidal vascularity index (CVI) and choroidal luminal area (LA), have been reported in age-related macular degeneration, diabetes, and other choroid-related diseases.17–23 These recent studies have shown that the CVI is a more stable and robust parameter of choroidal vascularity than choroidal thickness (CT) alone due to physiological and systemic-related variations that have seldom been reported in HM and PM.
Previously, we developed a novel method to automatically segment and quantify the CT and choroidal vasculature based on a deep learning algorithm, residual U-Net.24 In this study, we aimed to analyze the choroidal vascular alterations in PM and their correlations with visual impairment. This research has potential to be a novel strategy to monitor the progression of myopia and provide new insights regarding the prevention and treatment of PM.
Methods
Study Design
This was a prospective, cross-sectional study that was approved by the Ethics Committee of Wenzhou Medical University, Wenzhou, Zhejiang, China, and conducted in accordance with the tenets of the Declaration of Helsinki.
Subjects
We recruited 80 participants for this study, including 46 females and 34 males. Their mean age was 37 years (range, 21–59), mean SE was −8.41 D (range, −22.75 to 1.13), and mean AL was 27 mm (range, 21.60–33.22). All subjects were enrolled from September 2019 to January 2022 at The Affiliated Eye Hospital of Wenzhou Medical University, and signed informed consent was obtained from all participants. Both eyes of all participants were included in the study unless they did not meet the inclusion criteria or met the exclusion criteria. The eyes were divided into three groups: (1) control group, comprised of eyes with emmetropia and low myopia (EM/LM) with SE ranging from −3.0 to +1.0 D; (2) simple HM group, comprised of eyes with SE ≤ −6.0 D or AL ≥ 26.5 mm and without myopic pathological changes noted on fundus photography; and (3) the PM group, comprised of eyes with SE ≤ −6.0 D or AL ≥ 26.5 mm and with myopic maculopathy. The definition of PM was based on the International Meta-Analysis for Pathological Myopia classification system, in which eyes with diffuse choroidal atrophy or more severe atrophy were classified as having PM.25 The diagnoses of all eyes in the three groups were determined by two ophthalmologists. If there was any disagreement between the two ophthalmologists, another senior ophthalmologist made the final diagnosis. Three eyes had inconsistent diagnoses. All subjects were older than 18 years of age.
Eyes with intraocular pressure (IOP) > 21 mm Hg, corneal disease, severe cataract, age-related macular degeneration, diabetic retinopathy, history of intraocular surgery or other fundus changes related to systemic diseases (such as systemic lupus erythematosus), or serious complications of HM (such as retinoschisis) were excluded.
Clinical Examinations
All subjects underwent comprehensive ophthalmologic examinations that included refraction, BCVA, IOP, and slit-lamp examinations. SE was calculated as the spherical dioptric power plus half of the cylindrical dioptric power. BCVA was described as the logarithm of the minimum angle of resolution (logMAR). IOP was measured using a CANON TX-F Full Auto Tonometer (Canon Inc., Tokyo, Japan). The AL was measured using a Lenstar 900 (Haag-Streit USA, Mason, OH, USA). Digital 45° × 45° color fundus photographs were taken with a retinal camera (VISUCAM 224; Carl Zeiss Meditec, Jena, Germany).
Image Acquisition Protocol and Analysis
All participants underwent imaging using swept-source OCT (SS-OCT, VG200S; SVision Imaging, Henan, China) with a central wavelength of 1050 nm (Fig. 1). The scan speed was 200,000 A-scans per second with 6.3-µm axial resolution. A 12-mm radial line scan was performed to obtain two transverse section images (vertical and horizontal meridians) across the fovea. As individuals with high myopia are prone to reflex at the edge of images, 6-mm cross-sections of the macula, centered on the fovea, were selected for further analysis. The signal strength indices of all selected images were >4/10.
Figure 1.
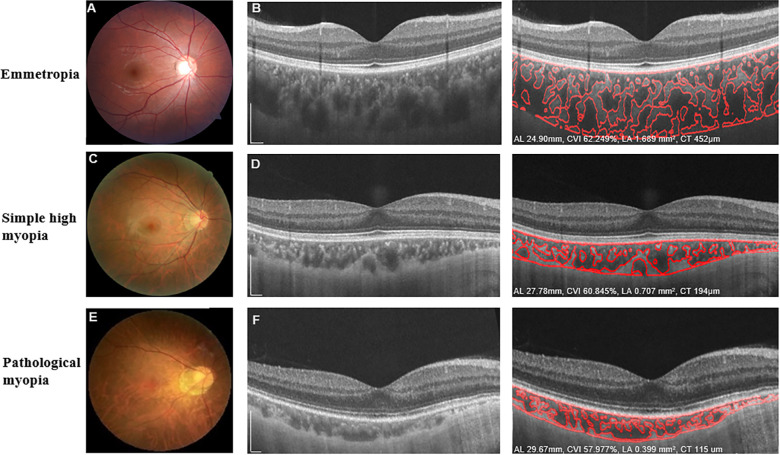
Characteristic fundus photographs and OCT images of eyes with emmetropia, simple high myopia, and pathological myopia. Fundus photographs (A, C, E) and OCT B-scan images (B, D, F) show the detailed automated segmentation of eyes with emmetropia, simple high myopia, and pathological myopia, respectively. For eyes with emmetropia (A, B), AL was 24.99 mm, the global macular CVI was 62.249%, global macular choroidal LA was 1.839 mm2, and global CT was 452 µm. For eyes with simple high myopia (C, D), AL was 27.78 mm, the global macular CVI was 60.845%, global macular choroidal LA was 0.707 mm2, and global CT was 194 µm. For eyes with pathological myopia (E, F), AL was 29.67 mm, the global macular CVI was 57.977%, global macular choroidal LA was 0.399 mm2, and global CT was 115 µm. Scale bars: 300 µm.
Before using custom-developed software to analyze all images, we used Bennett's formula, t = p × q × s, where t was the actual scan length, p was the magnification factor determined using the OCT imaging system camera, q was the magnification factor related to the eye, and s was the original measurement from the OCT imaging system, to adjust the OCT image magnification based on AL. When imaging an eye with an AL of 24.46 mm, the actual scanning range t would be equal to s. When imaging eyes with other ALs, the real scan length t was determined by the equation t = (AL – 1.82)/22.64 × s, as reported in our previous studies.16,26,27
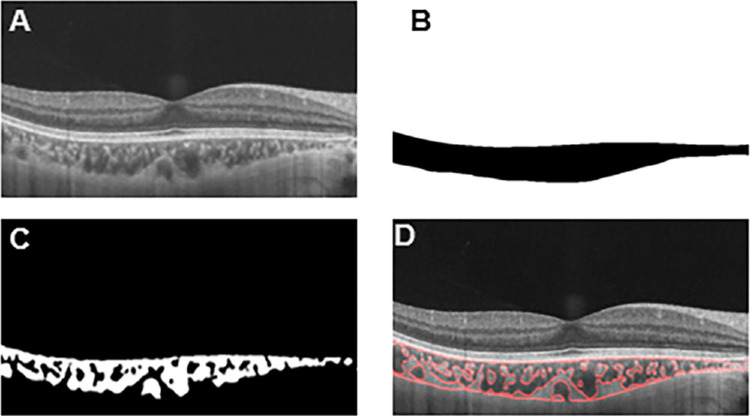
Subsequently, we used a deep learning approach to automatically quantify the choroidal parameters in the macular region with a diameter of 6.0 mm. All images were automatically analyzed by a custom deep learning algorithm based on a modified residual U-Net architecture to segment the choroidal boundaries. The residual U-Net is residual units applied to the deep network, replacing the conventional convolution units, which can achieve better performance with fewer parameters than traditional approaches. The distance between the two boundaries was defined as CT, and LA and stromal area (SA) were demarcated based on Niblack's auto-local threshold algorithm after binarization of the OCT images. The ratio of LA and total choroidal area (SA + LA) was defined as the CVI (Fig. 2).28 All segmentation analyses were performed by one masked reader. We obtained the choroidal parameters of the macular region in the vertical and horizontal directions.
Figure 2.
Progression of choroidal image binarization. (A) The original SS-OCT image. (B) Segmentation of the choroidal area. (C) Binarization of the choroidal area. (D) Overlay of the region of interest created after performing image binarization on the SS-OCT image.
Statistical Analyses
The main parameters are presented throughout as mean ± SD. Analysis was performed with SPSS Statistics 22.0 (IBM Corporation, Chicago, IL, USA). The different frequencies of sexes among the three groups were analyzed using χ2 tests. The differences in other parameters among the three groups were analyzed using one-way analysis of variance with Bonferroni-corrected multiple comparisons post hoc tests. Simple regression models (based on the generalized estimating equations [GEEs]) were used to analyze the associations of the choroidal parameters and other variables with the BCVA. Based on the GEEs, results from the simple regression models were then used to create a final multivariate model with BCVA as the outcome. Exponential and hyperbola functions were also used to investigate the relationships among choroidal parameters and AL and BCVA. Statistical significance was set at P < 0.05.
Results
Basic Patient Characteristics
The final cohort was composed of 136 eyes from 80 participants, including 42 eyes from 21 participants with EM/LM, 48 eyes from 26 participants with simple HM, and 46 eyes from 33 participants with PM (Table 1). There were no significant differences among the three groups in age, sex, or IOP (P = 0.406, P = 0.731, and P = 0.368, respectively). The PM group had greater myopia, longer AL, and worse BCVA than the EM/LM and HM groups. Moreover, the HM group had greater myopia, longer ALs, and worse BCVA than the EM/LM group (Table 1).
Table 1.
Basic Characteristics of Emmetropia/Low Myopia, Simple High Myopia, and Pathological Myopia Groups
| Characteristics | EM/LM | HM | PM | P * | P1† | P2‡ | P3§ |
|---|---|---|---|---|---|---|---|
| Patients/eyes, n | 21/42 | 26/48 | 33/46 | —|| | — | — | — |
| Age (y), mean ± SD | 38 ± 8 | 36 ± 6 | 38 ± 8 | 0.406 | 1.000 | 1.000 | 0.594 |
| Sex (male/female), n | 11/10 | 11/15 | 14/19 | 0.731 | 0.491 | 0.474 | 0.993 |
| IOP (mm Hg), mean ± SD | 13.46 ± 2.29 | 14.21 ± 2.16 | 14.03 ± 3.11 | 0.368 | 0.519 | 0.937 | 1.000 |
| SE (D), mean ± SD | −0.89 ± 1.18 | −8.86 ± 2.65 | −14.79 ± 3.49 | <0.001 | <0.001 | <0.001 | <0.001 |
| AL (mm), mean ± SD | 23.97 ± 1.23 | 27.21 ± 1.07 | 29.57± 1.59 | <0.001 | <0.001 | <0.001 | <0.001 |
| BCVA (logMAR), mean ± SD | −0.10 ± 0.07 | 0.01 ± 0.07 | 0.18 ± 0.17 | <0.001 | <0.001 | <0.001 | <0.001 |
P value among the three groups.
P value between the EM/LM and HM groups.
P value between the EM/LM and PM groups.
P value between the HM and PM groups.
Not performed.
Differences in Choroidal Structural and Vascular Parameters Among the Three Groups
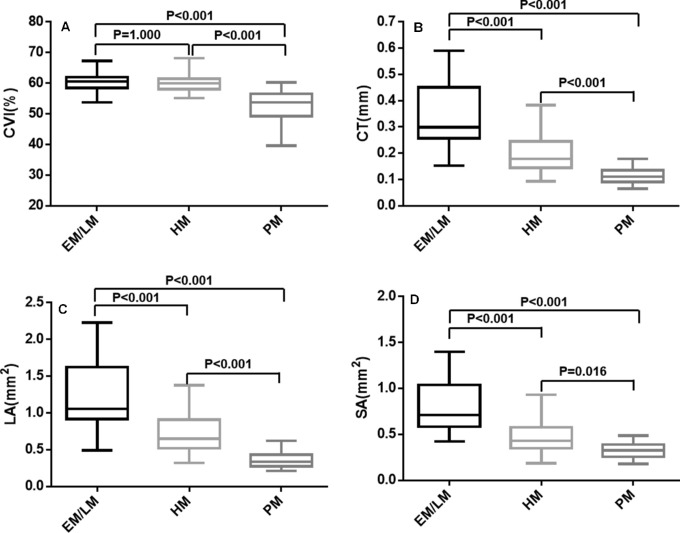
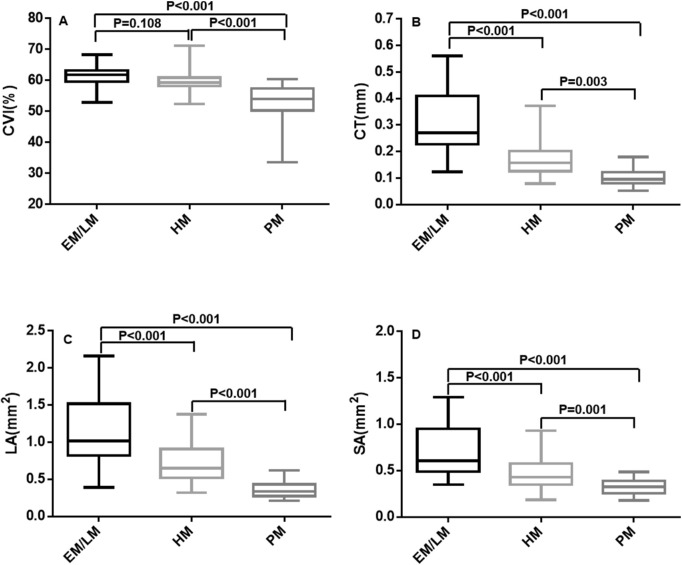
As shown in Figures 3 and 4, at both the vertical and horizontal meridians, the CVIs of the PM group were lower than those of the EM/LM and HM groups (P < 0.001, each), whereas there was no significant difference between the EM/LM and HM groups (P > 0.05). The CT, SA, and LA were significantly different among the three groups (P < 0.05, respectively).
Figure 3.
Box-and-whisker plots comparing the global choroidal parameters at the vertical meridian among the EM/LM, HM, and PM groups: (A) CVI; (B) CT; (C) choroidal LA; (D) choroidal SA. The median is represented by the middle line within each box, and the second and third quartiles are represented by the lower and upper segments of the box, respectively. The whiskers of the plot represent the minimum (bottom whisker) and the maximum (top whisker).
Figure 4.
Box-and-whisker plots comparing the global choroidal parameters at the horizontal meridian among the EM/LM, HM, and PM groups: (A) CVI; (B) CT; (C) choroidal LA; (D) choroidal SA. The median is represented by the middle line within each box, and the second and third quartiles are represented by the lower and upper segments of the box, respectively. The whiskers of the plot represent the minimum (bottom whisker) and the maximum (top whisker).
Associations of Choroidal Parameters With Axial Length
Changes in choroidal parameters with axial elongation are shown in Figure 5. The relationship between the CVI and AL was analyzed using elbow fitting. The analysis revealed a flexion point (27.26 mm) between changes in the CVI and AL. For the CVI that preceded the flexion point along the AL, change in the CVI was independent of the changes in AL. Thus, as AL increased, there was no significant change in the CVI. For AL greater than the flexion point, the CVI decreased as AL increased; thus, there was a negative correlation between the CVI and AL beyond the flexion point. Changes in the LA, SA, and CT were negatively correlated with an increasing AL (P < 0.001). The relationships between the AL and choroidal variables were further analyzed with exponential and hyperbola functions, and the results are shown in Supplementary Figure S1. All choroidal parameters were the mean values of the vertical and horizontal meridians.
Figure 5.
Scatterplots showing the correlation between AL and CVI, CT, LA, and SA: (A) CVI versus AL; (B) CT versus AL; (C) LA versus AL; (D) SA versus AL. All choroidal parameters are the mean values of the vertical and horizontal meridians. Each dot represents one eye.
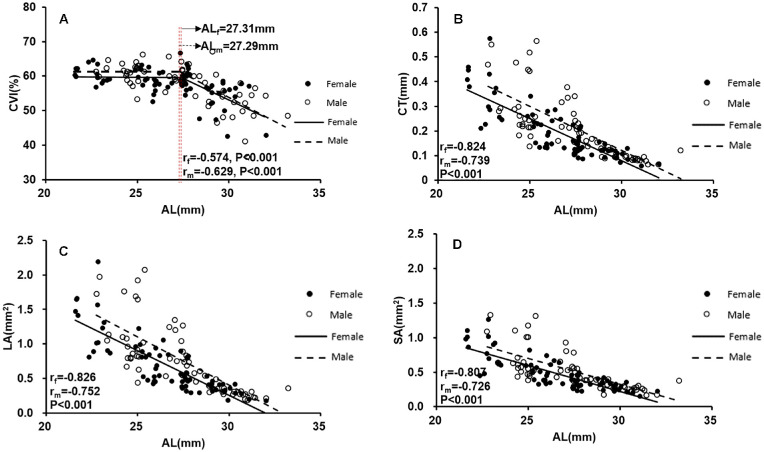
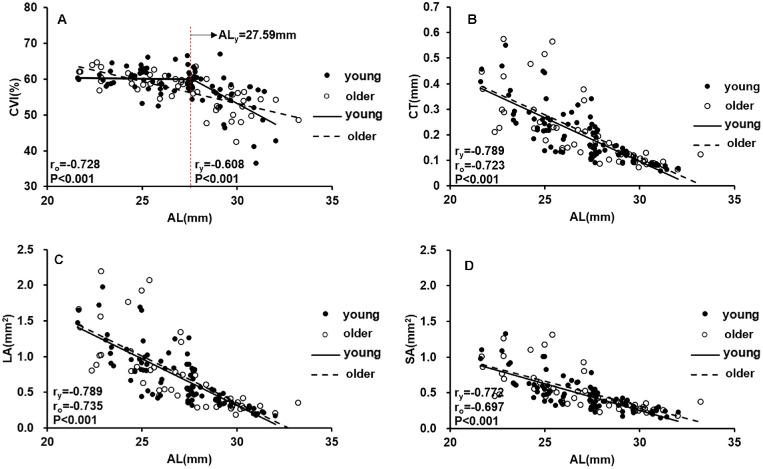
The subjects were then divided into male/female subgroups and younger/older subgroups to determine whether sex or age might influence the correlation between the CVI and axial elongation. Figure 6 showed that the changes in choroidal parameters with axial elongation were similar between female and male participants. Moreover, we found that there was still a flexion point (27.59 mm) between changes in the CVI and AL in participants younger than 40 years of age (Fig. 7), whereas changes in the CVI were negatively correlated with increasing AL in participants older than 40 years of age (P < 0.001).
Figure 6.
Scatterplots showing the correlation between AL and CVI, CT, LA, and SA in males and females: (A) CVI versus AL; (B) CT versus AL; (C) LA versus AL; (D) SA versus AL. All choroidal parameters are the mean values of the vertical and horizontal meridians. Each dot represents one eye.
Figure 7.
Scatterplots showing the correlation between AL and CVI, CT, LA, and SA in different age groups: (A) CVI versus AL; (B) CT versus AL; (C) LA versus AL; (D) SA versus AL. All choroidal parameters are the mean values of the vertical and horizontal meridians. Each dot represents one eye.
Associations of Choroidal Parameters and Other Variables With BCVA
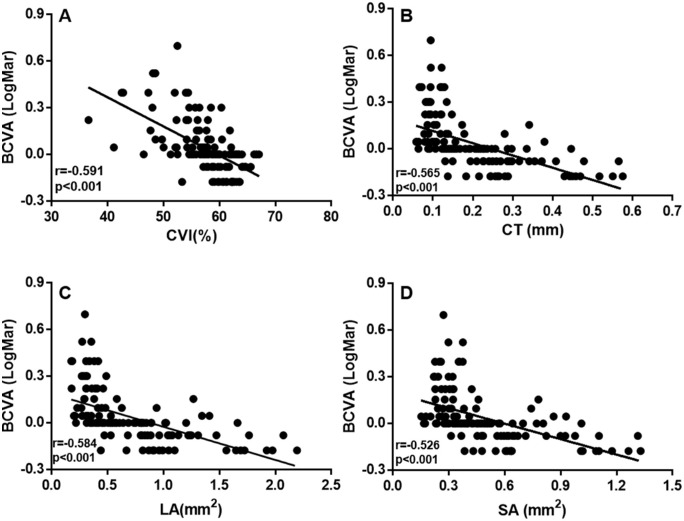
Simple GEE-based regression models showed that older age (P = 0.013), longer AL (P < 0.001), smaller CVI (P < 0.001), thinner CT (P < 0.001), smaller LA (P < 0.001), and smaller SA (P < 0.001) were significantly associated with worse BCVA (Table 2, Fig. 8). Sex (P = 0.714) was not associated with BCVA. Hyperbola function was performed to analyze the relationships among the other three choroidal parameters and BCVA (Supplementary Fig. S2). Parameters that were significantly correlated with BCVA were included in the multiple regression models (Table 2). In the final multiple regression models with BCVA as the outcome, only the CVI (P = 0.048), age (P < 0.001), and AL (P < 0.001) were significant factors for BCVA. All choroidal parameters were the mean values of the vertical and horizontal meridians.
Table 2.
Linear Regression Models Based on BCVA
| Simple Regression Analysis | Multiple Regression Analysis | |||||||
|---|---|---|---|---|---|---|---|---|
| Parameters | Unstandardized Coefficients | Standardized Coefficients | 95% CI | P | Unstandardized Coefficients | Standardized Coefficients | 95% CI | P |
| Sex | −0.013 | −0.034 | −0.055 to 0.080 | 0.714 | — | — | — | — |
| Age (y) | 0.005 | 0.002 | 0.001 to 0.009 | 0.013 | 0.005 | 0.001 | 0.002 to 0.008 | <0.001 |
| AL (mm) | 0.042 | 0.005 | 0.031 to 0.053 | <0.001 | 0.030 | 0.007 | 0.017 to 0.043 | <0.001 |
| CVI_average (%) | −0.019 | 0.003 | −0.025 to −0.012 | <0.001 | −0.009 | 0.005 | −0.018 to 0.000 | 0.048 |
| CT_average (mm) | −0.789 | 0.105 | −0.995 to −0.584 | <0.001 | 25.003 | 29.394 | −32.607 to 82.614 | 0.395 |
| LA_average (mm2) | −0.213 | 0.028 | −0.268 to −0.158 | <0.001 | −4.092 | 4.881 | −13.657 to 5.474 | 0.402 |
| SA_average (mm2) | −0.332 | 0.044 | −0.418 to −0.246 | <0.001 | −4.332 | 4.930 | −13.995 to 5.330 | 0.380 |
Figure 8.
Scatterplots showing the correlation between BCVA and CVI, LA, SA, and CT: (A) CVI versus BCVA; (B) CT versus BCVA; (C) LA versus BCVA; (D) SA versus BCVA. All choroidal parameters are the mean values of the vertical and horizontal meridians. Each dot represents one eye.
Discussion
In the present study, SS-OCT was used to evaluate choroidal changes in eyes with HM and PM. The thinning of the choroid found in this study is consistent with the findings of previous studies.3,5–16 Alterations of the choroidal vasculature in HM with or without pathological changes were further quantified. To our knowledge, this is the first report of changes in choroidal vasculature, such as the CVI, LA, and SA, in PM. Significant reductions in the CVI, LA, and SA were observed with axial elongation. Moreover, the CVI was significantly associated with BCVA, indicating that patients with a lower CVI had worse visual acuity. Consequently, the CVI might be a reliable imaging biomarker for monitoring progression of PM; thus, preventing a decrease in the CVI could be a clinical goal.
Importantly, a decrease in the CVI was found in the PM group compared to the control and HM groups. The significant difference in ALs between the EM/LM and HM groups was 3.25 mm, whereas the differences in the CVI for these two groups, 0.73% and 1.84% (vertical and horizontal, respectively), were not significant. Similarly, the difference in ALs between the HM and PM groups was 2.36 mm. However, in contrast to differences in the CVI for the EM/LM and HM groups, the differences between the HM and PM groups, 7.13% and 6.96 % (vertical and horizontal, respectively), were significant. These results suggest a sharp decrease in the CVI during the development of PM retinopathy, indicating that the relationship between the CVI and axial elongation is more complex than a simple linear correlation.
Axial elongation has been considered the main factor for a decrease in CT during the progression of HM in previous studies.4–6,12 In the present study, a nonlinear analysis revealed that there is a critical AL flexion point (approximately 27.26 mm) and that a negative linear correlation between the CVI and AL beyond the flexion point is evident, indicating that significant reduction of the CVI is triggered beyond the AL flexion point. The correlations of LA and SA with AL showed that the choroid was stretched due to axial elongation, resulting in choroidal thinning and an approximately parallel decrease in the LA and SA before the AL flexion point. Therefore, the CVI did not change significantly during this period. In contrast, changes in the LA were larger than those in the SA beyond the AL flexion point, which resulted in a decrease in the CVI. This indicates that the choroid might have been “overstretched” in this stage, and the loss of choroidal vasculature was much more significant than that of the choroidal stroma in PM.
Further analysis showed that sex did not affect the choroidal parameters with axis elongation. In contrast, the correlations between the choroidal parameters and AL differed between younger and older participants. Only participants who were ≤40 years of age showed a significant AL flexion point below which the CVI was unchanged with axial elongation. This indicates that there might also be a critical age beyond which choroidal perfusion loss is much more severe with axial elongation. Therefore, age would be another important factor that might influence choroidal perfusion accompanied with axial elongation in PM. In future studies, investigation of the critical flexion point of age and its influence on choroidal perfusion and visual function during the development of PM should be of great significance for the treatment of patients.
The nutrition and oxygen demands of photoreceptors are mainly met by the choroid.29 Previous studies have reported a relationship between choroidal thinning and visual function in patients with HM and PM.3–16 We demonstrated that the influence of photoreceptor degeneration on visual impairment is affected by choroidal thickness.16 However, a decrease in choroidal thickness has been reported in older and hypertensive individuals,28 which might influence the application of CT in evaluating the severity of HM.5 In contrast, the CVI is independent of these factors.29 In the present study, the CVI was also correlated with BCVA, and multiple regression analysis showed that the decline in the CVI was the factor most related to visual impairment. Therefore, it has been speculated that the CVI could be a reliable parameter for monitoring the progression of PM and predicting visual acuity loss in the future. Restoring the CVI, which indicates improvement of choroidal perfusion, might be a novel intervention target to prevent the progression of visual impairment in PM.
This study has some limitations. First, our study included only a few eyes with advanced PM; however, we believe that this did not affect our results significantly, considering that the main goal of our research was to investigate the difference between simple and early PM. Second, we could only obtain two-dimensional information regarding the choroid in this study. In the future, the application of three-dimensional imaging technology might help to characterize more details regarding choroidal structural and vascular changes in PM. Moreover, longitudinal studies would provide more evidence regarding choroidal changes in PM and their correlations with visual function.
In conclusion, we demonstrated that decreases in choroidal vasculature were significantly correlated with visual impairment in PM. Regarding axial elongation, the CVI decreased nonlinearly, whereas the other choroidal parameters decreased linearly. The CVI was the choroidal parameter most highly correlated with BCVA and might be a reliable imaging biomarker for monitoring the progression of PM. Clinicians should pay close attention to alterations in the choroidal vasculature in PM and realize that preventing a decrease in the CVI might be a vital clinical goal for the treatment of PM.
Supplementary Material
Acknowledgments
Supported by research grants from the Key R&D Program Projects in Zhejiang Province (2019C03045); Natural Science Foundation of Zhejiang Province (LQ21H120007); National Nature Science Foundation of China (8210041176); National Key Research and Development Program of China (2020YFC2008200); Wenzhou Municipal Science and Technology Bureau (2018ZY016); Research Fund of Wenzhou Institute, Chinese Academy of Sciences (WIUCASYJ2020004, WIUCASQD2020009); and National Nature Science Foundation of China (Grant No. 82101177).
Disclosure: Y. Wang, None; S. Chen, None; J. Lin, None; W. Chen, None; H. Huang, None; X. Fan, None; X. Cao, None; M. Shen, None; J. Ye, None; S. Zhu, None; A. Xue, None; F. Lu, None; Y. Shao, None
References
- 1. Holden BA, Fricke TR, Wilson DA, et al.. Global prevalence of myopia and high myopia and temporal trends from 2000 through 2050. Ophthalmology . 2016; 123(5): 1036–1042. [DOI] [PubMed] [Google Scholar]
- 2. Liu HH, Xu L, Wang YX, Wang S, You QS.. Prevalence and progression of myopic retinopathy in Chinese adults: the Beijing Eye Study. Ophthalmology . 2010; 117(9): 1763–1768. [DOI] [PubMed] [Google Scholar]
- 3. Grossniklaus HE, Green WR.. Pathologic findings in pathologic myopia. Retina. 1992; 12(2): 127–133. [DOI] [PubMed] [Google Scholar]
- 4. Abdolrahimzadeh S, Parisi F, Plateroti AM, et al.. Visual acuity, and macular and peripapillary thickness in high myopia. Curr Eye Res . 2017; 42(11): 1468–1473. [DOI] [PubMed] [Google Scholar]
- 5. Fang Y, Du R, Nagaoka N, et al.. OCT-based diagnostic criteria for different stages of myopic maculopathy. Ophthalmology . 2019; 126(7): 1018–1032. [DOI] [PubMed] [Google Scholar]
- 6. Flores-Moreno I, Lugo F, Duker JS, Ruiz-Moreno JM.. The relationship between axial length and choroidal thickness in eyes with high myopia. Am J Ophthalmol . 2013; 155(2): 314–319.e1. [DOI] [PubMed] [Google Scholar]
- 7. Flores-Moreno I, Ruiz-Medrano J, Duker JS, Ruiz-Moreno JM.. The relationship between retinal and choroidal thickness and visual acuity in highly myopic eyes. Br J Ophthalmol. 2013; 97(8): 1010–1013. [DOI] [PubMed] [Google Scholar]
- 8. Fujiwara T, Imamura Y, Margolis R, Slakter JS, Spaide RF.. Enhanced depth imaging optical coherence tomography of the choroid in highly myopic eyes. Am J Ophthalmol. 2009; 148(3): 445–450. [DOI] [PubMed] [Google Scholar]
- 9. Gupta P, Saw SM, Cheung CY, et al.. Choroidal thickness and high myopia: a case–control study of young Chinese men in Singapore. Acta Ophthalmol . 2015; 93(7): e585–e592. [DOI] [PubMed] [Google Scholar]
- 10. Ho M, Liu DT, Chan VC, Lam DS.. Choroidal thickness measurement in myopic eyes by enhanced depth optical coherence tomography. Ophthalmology . 2013; 120(9): 1909–1914. [DOI] [PubMed] [Google Scholar]
- 11. Ikuno Y, Tano Y.. Retinal and choroidal biometry in highly myopic eyes with spectral-domain optical coherence tomography. Invest Ophthalmol Vis Sci . 2009; 50(8): 3876–3880. [DOI] [PubMed] [Google Scholar]
- 12. Liu B, Wang Y, Li T, et al.. Correlation of subfoveal choroidal thickness with axial length, refractive error, and age in adult highly myopic eyes. BMC Ophthalmol. 2018; 18(1): 127. [DOI] [PMC free article] [PubMed] [Google Scholar]
- 13. Nishida Y, Fujiwara T, Imamura Y, Lima LH, Kurosaka D, Spaide RF.. Choroidal thickness and visual acuity in highly myopic eyes. Retina . 2012; 32(7): 1229–1236. [DOI] [PubMed] [Google Scholar]
- 14. Pang CE, Sarraf D, Freund KB.. Extreme choroidal thinning in high myopia. Retina. 2015; 35(3): 407–415. [DOI] [PubMed] [Google Scholar]
- 15. Wang NK, Lai CC, Chu HY, et al.. Classification of early dry-type myopic maculopathy with macular choroidal thickness. Am J Ophthalmol. 2012; 153(4): 669–677.e1–2. [DOI] [PubMed] [Google Scholar]
- 16. Ye J, Shen M, Huang S, et al.. Visual acuity in pathological myopia Is correlated with the photoreceptor myoid and ellipsoid zone thickness and affected by choroid thickness. Invest Ophthalmol Vis Sci. 2019; 60(5): 1714–1723. [DOI] [PubMed] [Google Scholar]
- 17. Ambiya V, Goud A, Rasheed MA, Gangakhedkar S, Vupparaboina KK, Chhablani J.. Retinal and choroidal changes in steroid-associated central serous chorioretinopathy. Int J Retina Vitreous. 2018; 4: 11. [DOI] [PMC free article] [PubMed] [Google Scholar]
- 18. Foo VHX, Gupta P, Nguyen QD, et al.. Decrease in choroidal vascularity index of Haller's layer in diabetic eyes precedes retinopathy. BMJ Open Diabetes Res Care. 2020; 8(1): e001295. [DOI] [PMC free article] [PubMed] [Google Scholar]
- 19. Gupta C, Tan R, Mishra C, et al.. Choroidal structural analysis in eyes with diabetic retinopathy and diabetic macular edema—a novel OCT based imaging biomarker. PLoS One. 2018; 13(12): e0207435. [DOI] [PMC free article] [PubMed] [Google Scholar]
- 20. Kim M, Ha MJ, Choi SY, Park YH.. Choroidal vascularity index in type-2 diabetes analyzed by swept-source optical coherence tomography. Sci Rep . 2018; 8(1): 70. [DOI] [PMC free article] [PubMed] [Google Scholar]
- 21. Kim RY, Chung DH, Kim M, Park YH.. Use of choroidal vascularity index for choroidal structural evaluation in central serous chorioretinopathy with choroidal neovascularization. Retina . 2020; 40(7): 1395–1402. [DOI] [PubMed] [Google Scholar]
- 22. Koh LHL, Agrawal R, Khandelwal N, Sai Charan L, Chhablani J.. Choroidal vascular changes in age-related macular degeneration. Acta Ophthalmol . 2017; 95(7): e597–e601. [DOI] [PubMed] [Google Scholar]
- 23. Rasheed MA, Goud A, Mohamed A, Vupparaboina KK, Chhablani J.. Change in choroidal vascularity in acute central serous chorioretinopathy. Indian J Ophthalmol . 2018; 66(4): 530–534. [DOI] [PMC free article] [PubMed] [Google Scholar]
- 24. Zheng G, Jiang YF, Shi C, et al.. Deep learning algorithms to segment and quantify the choroidal thickness and vasculature in swept-source optical coherence tomography images. J Innov Opt Health Sci . 2021; 14(1): 2140002. [Google Scholar]
- 25. Ohno-Matsui K, Kawasaki R, Jonas JB, et al.. International photographic classification and grading system for myopic maculopathy. Am J Ophthalmol . 2015; 159(5): 877–883.e7. [DOI] [PubMed] [Google Scholar]
- 26. Wang YY, Ye J, Shen MX, et al.. Photoreceptor degeneration is correlated with the deterioration of macular retinal sensitivity in high myopia. Invest Ophthalmol Vis Sci. 2019; 60(8): 2800–2810. [DOI] [PubMed] [Google Scholar]
- 27. Yang Y, Wang J, Jiang H, et al.. Retinal microvasculature alteration in high myopia. Invest Ophthalmol Vis Sci. 2016; 57(14): 6020–6030. [DOI] [PubMed] [Google Scholar]
- 28. Agrawal R, Gupta P, Tan KA, Cheung CM, Wong TY, Cheng CY.. Choroidal vascularity index as a measure of vascular status of the choroid: measurements in healthy eyes from a population-based study. Sci Rep . 2016; 6: 21090. [DOI] [PMC free article] [PubMed] [Google Scholar]
- 29. Nickla DL, Wallman J.. The multifunctional choroid. Prog Retin Eye Res. 2010; 29(2): 144–168. [DOI] [PMC free article] [PubMed] [Google Scholar]
Associated Data
This section collects any data citations, data availability statements, or supplementary materials included in this article.


