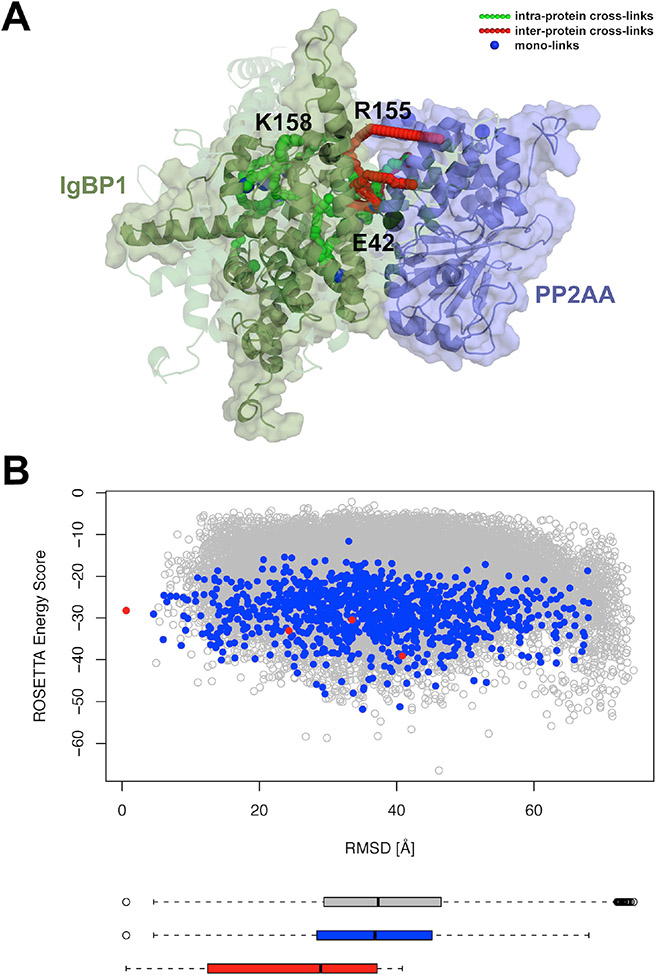
Figure 2.
Improvement of model prediction and scoring with XL-MS data. A, Best scoring models of IgBP1 (green) complexed with PP2AA (purple), with the opaque cartoon depicting the best scoring model from the largest cluster and the more transparent cartoons depicting the best scoring models from 2-4th largest clusters. Crosslinks are depicted as green, red, and blue spheres, with black spheres representing mutations. B, Rosetta score versus RMSD to the largest cluster plot for models with minimum of six inter-protein XLs (grey), minimum of six inter-protein XLs with binding interface larger than 900 Å2 (blue), and representative models from the four biggest clusters (red). Figure reproduced under the Creative Commons License from Kahraman et al. (2013); copyright 2013 PLOS.

