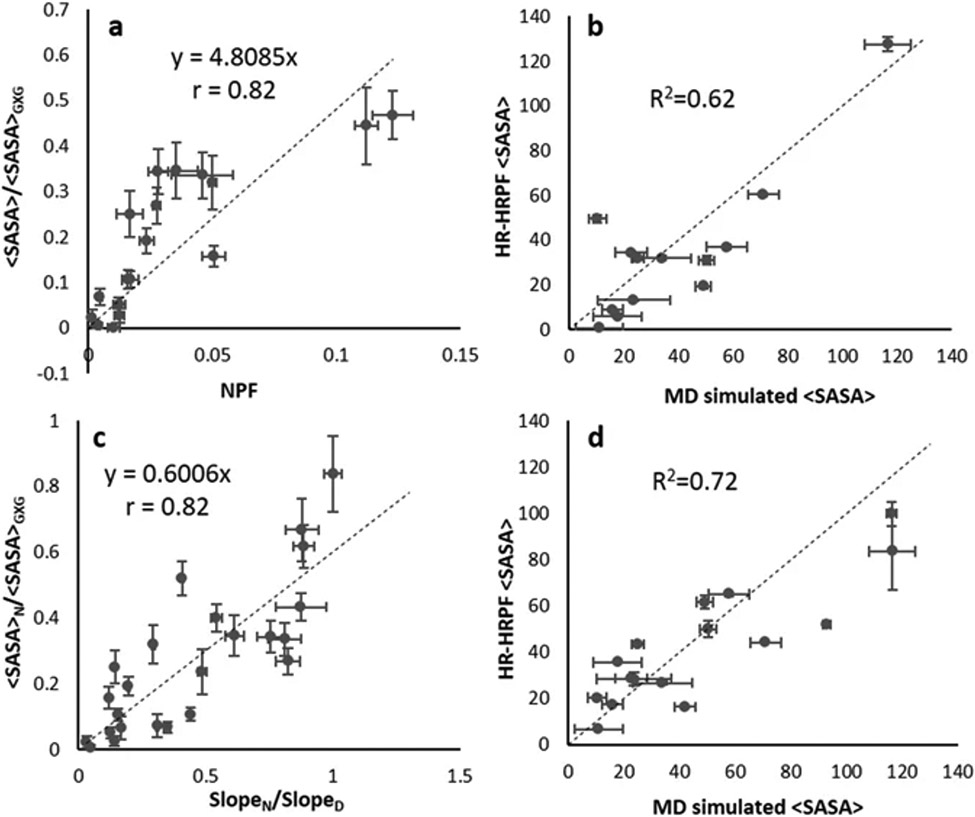
Figure 4.
Comparison of prediction equations using SASA and HRPF data. a, prediction equation between relative SASA (<SASA>/<SASA>GXG) and normalized protection factor (slopeN/relative intrinsic reactivity) using myoglobin data for residue types WYFHLI. b, lysozyme <SASA> calculated using prediction equation derived from (a) versus SASA observed in MD simulations. c, prediction equation between relative SASA of the native (<SASA>N/<SASA>GXG) and rate constant ratio (slopeN/slopeD) for all non-sulfur containing myoglobin residues. d, lysozyme SASA calculated using prediction equation shown in (c) versus SASA observed in MD simulations. Figure reproduced under the Creative Commons License from Xie et al. (2017); copyright 2017 Springer Nature.

