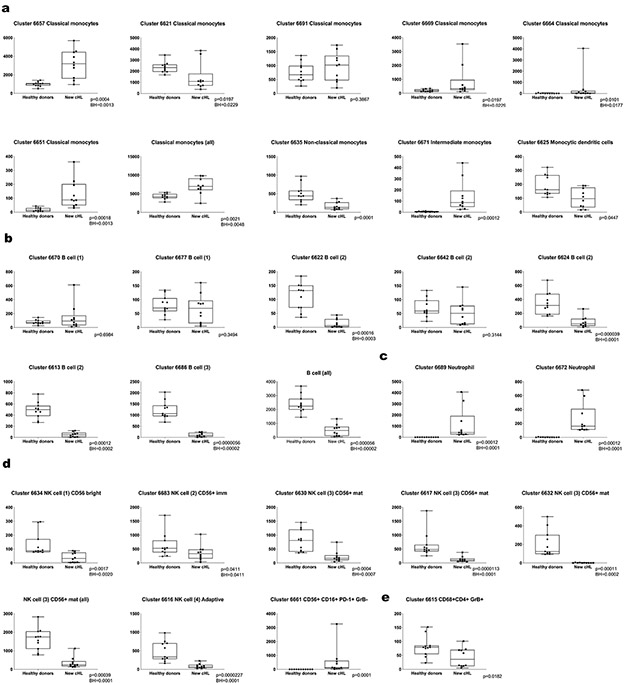
Extended Data Figure 6. Comparison of CD3− populations in healthy donors versus patients with newly diagnosed cHL.
To quantify differences between these 2 groups, patients with newly diagnosed cHL (n=10) and relapsed/refractory cHL (n=35), we determined the number of cells that each sample contributed to a given cluster and applied a Wilcoxon rank sum test (two-sided nominal p-values) with Benjamini-Hochberg (BH) corrections for p ≤ 0.05 (Classical Monocytes, Neutrophils, B cells and NK cells separately). One patient with newly diagnosed cHL who had sufficient numbers of CD3− sampled events in Extended Data Figures 6-8 had insufficient numbers of CD3+ sampled events and was excluded from the CD3+ analysis in Extended Data Figures 3-5). One patient with relapsed/refractory cHL had sufficient numbers of CD3+ sampled events for inclusion in Extended Data Figures 4-5 but had insufficient numbers of CD3− sampled events and was excluded from the CD3− analyses in Extended Data Figures 6-8. Shown here graphically are box plots (generated in GraphPad Prism) defining the 25th and 75th percentile and median values and whiskers for minimum and maximum values: a) Monocyte clusters; b) B cell clusters [(1) CXCR5− CD73− IRF4−, (2) CXCR5+ CD73−IRF4−, (3)CXCR5+ CD73+ IRF4+] ; c) Neutrophils; d) NK cell clusters and e) CD68+CD4+GrB+ cells.

