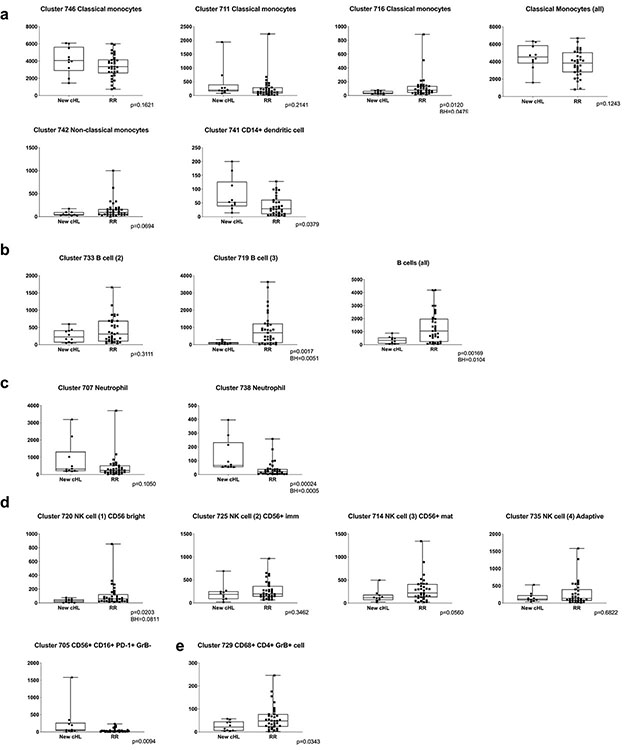
Extended Data Figure 7. Comparison of CD3− populations in patients with newly diagnosed cHL versus relapsed/refractory cHL (all) at baseline.
To quantify differences between these 2 groups, patients with newly diagnosed cHL (n=10) and relapsed/refractory cHL (n=35), we determined the number of cells that each sample contributed to a given cluster and applied a Wilcoxon rank sum test (two-sided nominal p-values) with Benjamini-Hochberg (BH) corrections for p ≤ 0.05 (Classical Monocytes, Neutrophils, B cells and NK cells separately). Shown here graphically are box plots (generated in GraphPad Prism) defining the 25th and 75th percentile and median values and whiskers for minimum and maximum values: a) Monocyte clusters; b) B cell clusters [(2) CXCR5+ CD73−IRF4−, (3) CXCR5+ CD73+ IRF4+]; c) Neutrophils; d) NK cell clusters and e) CD68+CD4+GrB+ cells.

