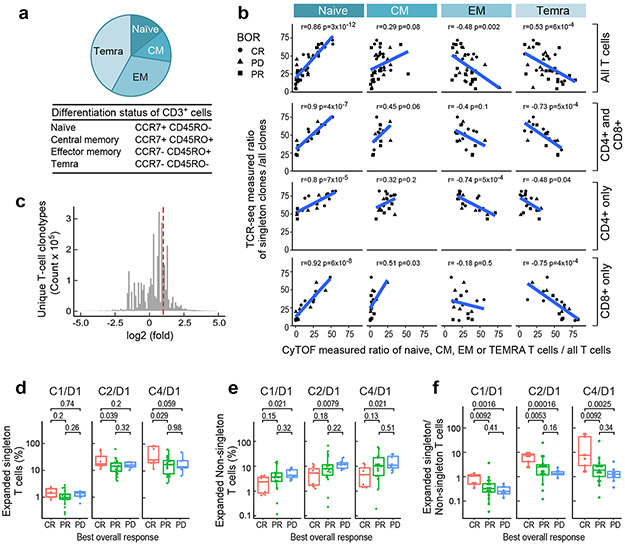
Figure 2. Clonal expansion following PD-1 blockade.
(a) The median CyTOF-based measurement of CD3+ T-cell differentiation subsets (naïve, central memory [CM], effector memory [EM] and TEMRA) in patients with relapsed/refractory cHL and ASCT ≥ 1 year prior to anti-PD-1 treatment (n=38 total). (b) Correlation between the relative abundance of TCR-seq measured singleton clones (ratio of singleton clones/ all clones) and relative abundance of CyTOF-defined T-cell differentiation subsets (ratio of naïve, CM, EM or TEMRA/ all T cells). Analyses were performed in all CD3+ T cells (top panel, n=38); the combination of sorted CD4+ and CD8+ T cells (upper middle panel); CD4+ T cells only (lower middle panel); and CD8+ T cells only (bottom panel) (CD4+ and CD8+, CD4+ only and CD8+ only, n=20). The Pearson’s correlation was applied and the two-sided p-value was estimated by a T distribution. (c) Unique T- cell clonotypes in patients with relapsed/refractory cHL treated with PD-1 blockade. All patients in the analysis began nivolumab treatment ≥ 1 year following myeloablative therapy and ASCT. TCR sequences (clonotypes) from baseline (C1/D1) and on-treatment (C2/D1 and C4/D1) samples. The area to the right of the dotted red line denotes T-cell clonotypes with 2-fold or greater expansion following treatment. Clonotypes at zero or below are unchanged or decreased/lost with treatment. The distribution is for 4,045,691 clonotypes from the 34 trial patients with available samples from all 3 timepoints (C1D1, C2D1 and C4D1). (d, e and f) The percent expansion of singleton clones (0 or 1 copy at baseline) (d), non-singleton clones which have 2 or more copies at baseline (e) and the ratio of expanded singleton/non-singleton clones (f) in patients with CR, PR or PD to PD-1 blockade. Only patients with samples at all three time-points (n=34) were included in the analysis. C1D1 shows baseline (pretreatment) levels of clones that subsequently expand at C2/D1 and C4/D1. Patients with CR to PD-1 blockade have significantly greater expansion of singleton, as opposed to non-singleton, clones (Wilcoxon rank sum test with two-sided p-values). For all box plots, the lower and upper hinges correspond to the 25th and 75th percentiles. The whiskers extend from the largest to smallest value but no further than 1.5 x IQR with outliers plotted individually.

