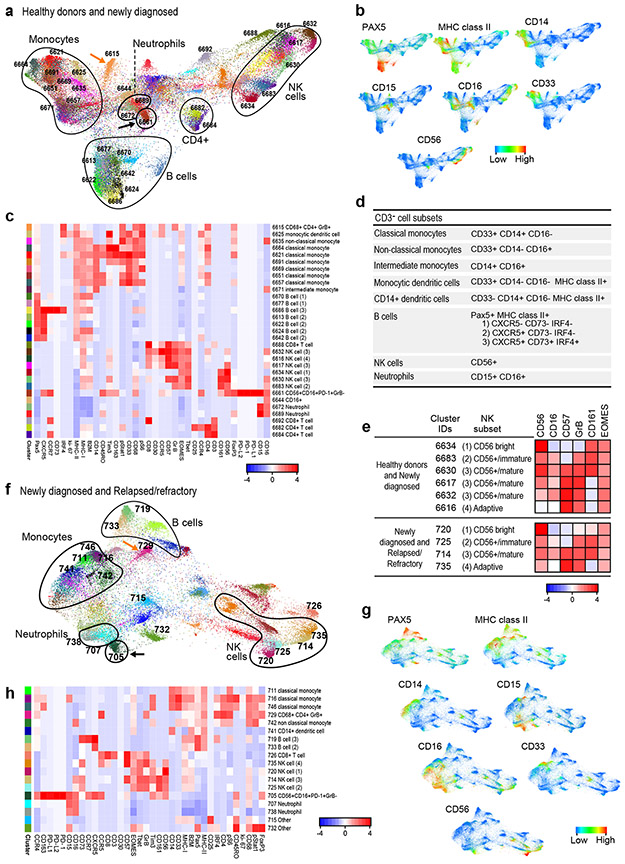
Figure 5. Analyses of circulating CD3− cells in healthy donors and patients with newly diagnosed or relapsed/refractory cHL.
(a) FDL of circulating CD3− cells from healthy donors and newly diagnosed patients with cHL. Every unique population (cluster) is labelled with a distinct color. (b) Major lineages in (a) defined by expression levels of key markers: Pax5, MHC class II (B cells); CD33, CD14, CD16, MHC class II (monocytes); and CD56, CD16 (NK cells). (c) Heatmap showing relative expression of CyTOF panel proteins in clusters with > 100 cells in ≥ 10% of samples from (a). (d) Markers used to identify major CD3− subsets. (e) Markers used to characterize NK stages of differentiation. (f) FDL of circulating CD3− cells from patients with newly diagnosed and relapsed/refractory cHL. (g) Major lineages in (f) defined by expression of the indicated markers (as in b). (h) Heatmap showing relative expression of CyTOF panel proteins in clusters with 100 cells in ≥ 10% of samples in (f). For inclusion in the analyses of CD3− clusters in healthy donors (n=11) and patients with newly diagnosed cHL (n=10) in (a), available specimens must have had 12000 sampled events. For inclusion in the analyses of CD3− clusters in patients with newly diagnosed cHL (n= 10) and relapsed/refractory cHL (n=35) in (f), available specimens must have had 7500 sampled events. One patient with relapsed/refractory cHL who had sufficient events for the analysis of CD3+ clusters in (Figure 3f) had <7500 CD3− sampled events and was excluded from the CD3− analysis in (f).

