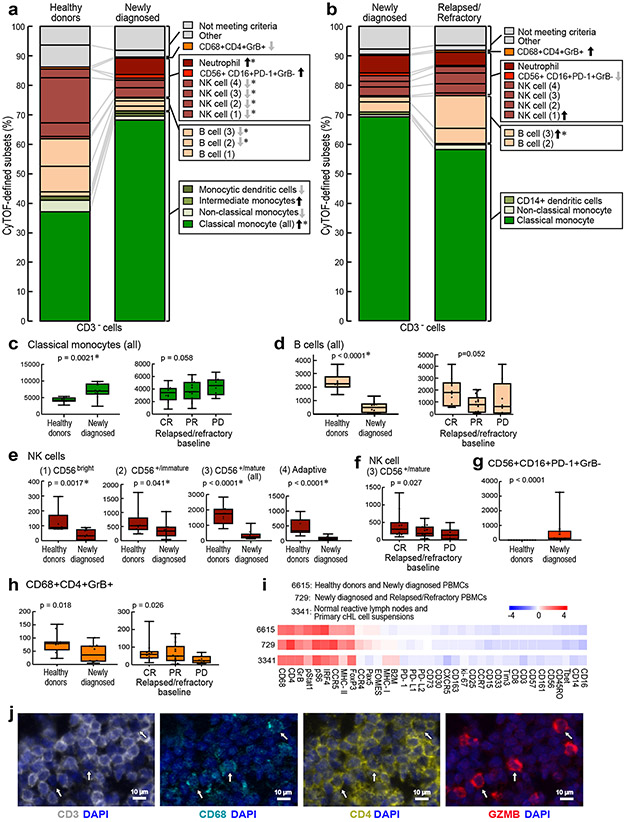
Figure 6. Comparative analyses of CD3− clusters in healthy donors and patients with newly diagnosed and relapsed/refractory cHL.
The differences in abundance of the CD3− clusters in healthy donors versus newly diagnosed patients (a) and newly diagnosed versus relapsed/refractory patients (b) are displayed in comparison bar graphs with highlighted statistically significant differences (Wilcoxon rank sum test with nominal two-sided p-values ≤0.05). P-values that remain significant after Benjamini-Hochberg correction are noted (*). See also extended data Figs. 6a-d, 7a-d, 8a-d for exact p-values. (a) Healthy donors versus newly diagnosed patients. (b) Newly diagnosed patients versus patients with relapsed/refractory cHL. (c) Classical monocytes (all) at baseline in healthy donors versus newly diagnosed patients (left) and patients with cHL relapsed/refractory by BOR (right). (d) B cells (all) at baseline in healthy donors versus newly diagnosed patients (left) and patients with relapsed/refractory cHL by BOR (right). (e) NK cell subsets at baseline in healthy donors versus newly diagnosed patients. (f) CD56+/mature NK cells at baseline in patients with relapsed/refractory disease by BOR. (g) CD56+CD16+PD-1+GrB− subset at baseline in healthy donors versus newly diagnosed patients. (h) CD3−CD68+CD4+GrB+ subset at baseline in healthy donors versus newly diagnosed patients (left) and relapsed/refractory patients by BOR (right). Clusters with similar phenotypes, such as classical monocytes 6664, 6621, 6691, 6669, 6651 and 6657, were collapsed for these analyses. In panels c-h, differences between healthy and newly diagnosed groups were assessed by Wilcoxon rank sum test and Cuzick trend test was used to compare CRs, PRs and PDs. All tests were two-sided and equal variance was not assumed. Given the heterogeneity in CD3− cells, nominal p-values are provided for all individual cluster comparisons. Separate Benjamini-Hochberg corrections were performed in classical monocytes, B cells or NK cell groups; nominal p values that retain significance are noted (*). All box plots (generated in GraphPad Prism) define the 25th and 75th percentile and median values and whiskers for minimum and maximum values. (i) Full phenotype of the CD3−CD68+CD4+GrB+ clusters from PBMCs of healthy donors and newly diagnosed patients with cHL (ID 6615) and newly diagnosed and relapsed/refractory patients with cHL (ID 729) and normal reactive lymph nodes and primary cHL cell suspensions (ID 3341)31. (j) Multiparametric immunofluorescence of CD3, CD68, CD4 and Granzyme B with DAPI counterstain in one of the four examined biopsies of relapsed cHL. In this representative field of view, white arrows denote CD3−CD68+CD4+GrB+ cells, with an illustrative enlarged cell in the inset (left upper corner). For inclusion in the analyses of CD3− clusters in healthy donors (n=11) and patients with newly diagnosed cHL (n=10) in (a), available specimens must have had 12000 sampled events. For inclusion in the analyses of CD3− clusters in patients with newly diagnosed cHL (n=10) and relapsed/refractory cHL (n=35, [(CR n=12, PR n=15, PD n=8)] in (b), (c), (d), (e), (f), (g) and (h), available specimens must have had 7500 sampled events. One patient with newly diagnosed cHL who had sufficient numbers of CD3− sampled events in (a) had insufficient numbers of CD3+ sampled events and was excluded from the CD3+ analysis (in Fig. 3a). One patient with relapsed/refractory cHL had sufficient numbers of CD3+ sampled events for inclusion in (Fig. 3f) but had insufficient numbers of CD3− sampled events and was excluded from the CD3− analyses (b), (c), (d), (e), (f), (g) and (h).

