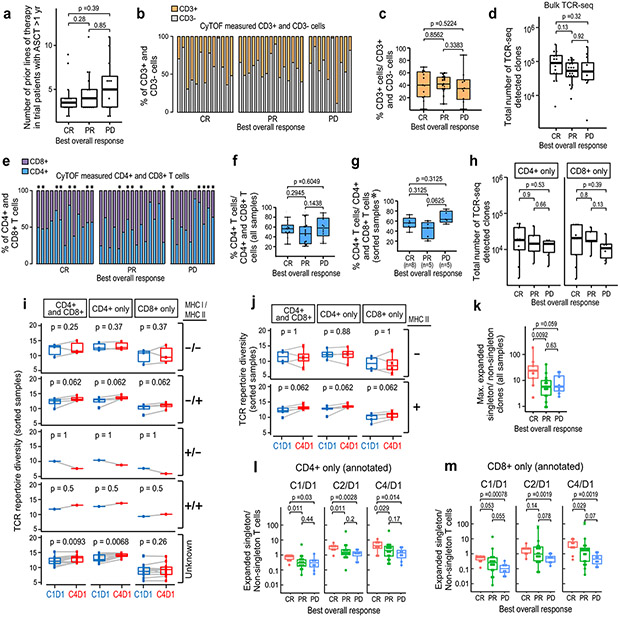
Extended Data Figure 1. Analyses of peripheral TCR repertoire diversity at baseline and following PD-1 blockade.
a) Number of prior therapies in trial patients who were treated with nivolumab ≥ 1 yr after ASCT by best overall response to PD-1 blockade (CR n=14, PR n=18, PD n=12). b) Percentages of CD3+ and CD3− viable cells at baseline in trial patients with relapsed/refractory cHL. Viable singlet cells identified by manual gating of CyTOF data were divided according to CD3 expression (CD3−, grey and CD3+, orange, n=38). Individual samples from patients with available CyTOF files who had relapsed/refractory cHL with ≥ 1 year between nivolumab and prior myeloablative ASCT are shown (n=38) (CR n=13, PR n=15, PD n=10). c) Comparison of baseline CD3+ populations in trial patients with relapsed/refractory cHL (from b) according to their subsequent response to PD1 blockade d) Total number of TCR-seq detected clones at baseline in trial patients (from a) according to their subsequent response to PD1 blockade. e) Percentages of CD4+ (blue) and CD8+ (purple) cells at baseline in trial patients with relapsed/refractory cHL. CD3+ cells identified (from b) and divided according to CD4+ or CD8+ expression by manual gating of CyTOF data. Additional cryopreserved samples from indicated cases (*) were available for CD4+ and CD8+ sorting (n=18, 2 excluded from this analysis as no CyTOF files available). f) Comparison of baseline CD4+ populations in all trial patients with relapsed/ refractory cHL (from e) according to their subsequent response to PD1 blockade (CR, PR, PD). g) Comparison of baseline CD4+ populations in trial patients with relapsed/refractory cHL (from e*) with additional PBMC samples sorted for CD4+ and CD8+ T cells (n=18). h) Total numbers of CD4+ and CD8+ TCR-seq detected clones at baseline in trial patients (from g) according to their subsequent response to PD-1 blockade. Differences between groups in panels a, c, d, f, g and h were assessed with a Wilcoxon rank sum test of the median with two-tailed p values. i) Changes in TCR diversity from C1D1 to C4D1 in the subset of trial patients with known HRS cell expression of MHC class I and MHC class II and CD4+ and CD8+ TCRseq data (n=9). Definitions of positive (positive or decreased) and negative expression of MHC class I and class II on HRS cells previously described in (Roemer et al 20184). j) Changes in TCR diversity from C1D1 to C4D1 separated by HRS cell expression of MHC class II only, samples from h. Differences in panels i and j were assessed by Wilcoxon rank sum test with one-sided p-values. k) The ratio of maximum expansion of singleton clones (0 or 1 copy at baseline)/ non-singleton clones which have 2 or more copies at baseline in patients with BOR of CR (n=9), PR (n=17) or PD (n=8) to PD-1 blockade. Only patients with all 3 timepoints are included in the analysis. Differences between groups were assessed with a Wilcoxon rank sum test of the median, two-tailed p values. (l and m) The ratio of expanded singleton / non-singleton clones from CD4+ only T cells (l) or CD8+ only T cells (m) from patients with CR, PR or PD to PD-1 blockade (n=20). Differences in panels l and m were assessed by Wilcoxon rank sum test with one-sided p-values. Graphpad Prism (v8) or R (ggplot function) was used to generate box plots (GraphPad Prism panels b, c, e-g and R panels a, d, h-m). The box corresponds to the first and third quartiles and whiskers define minimum and maximum values. Outliers beyond 1.5x IQR in R- generated plots are plotted individually.

