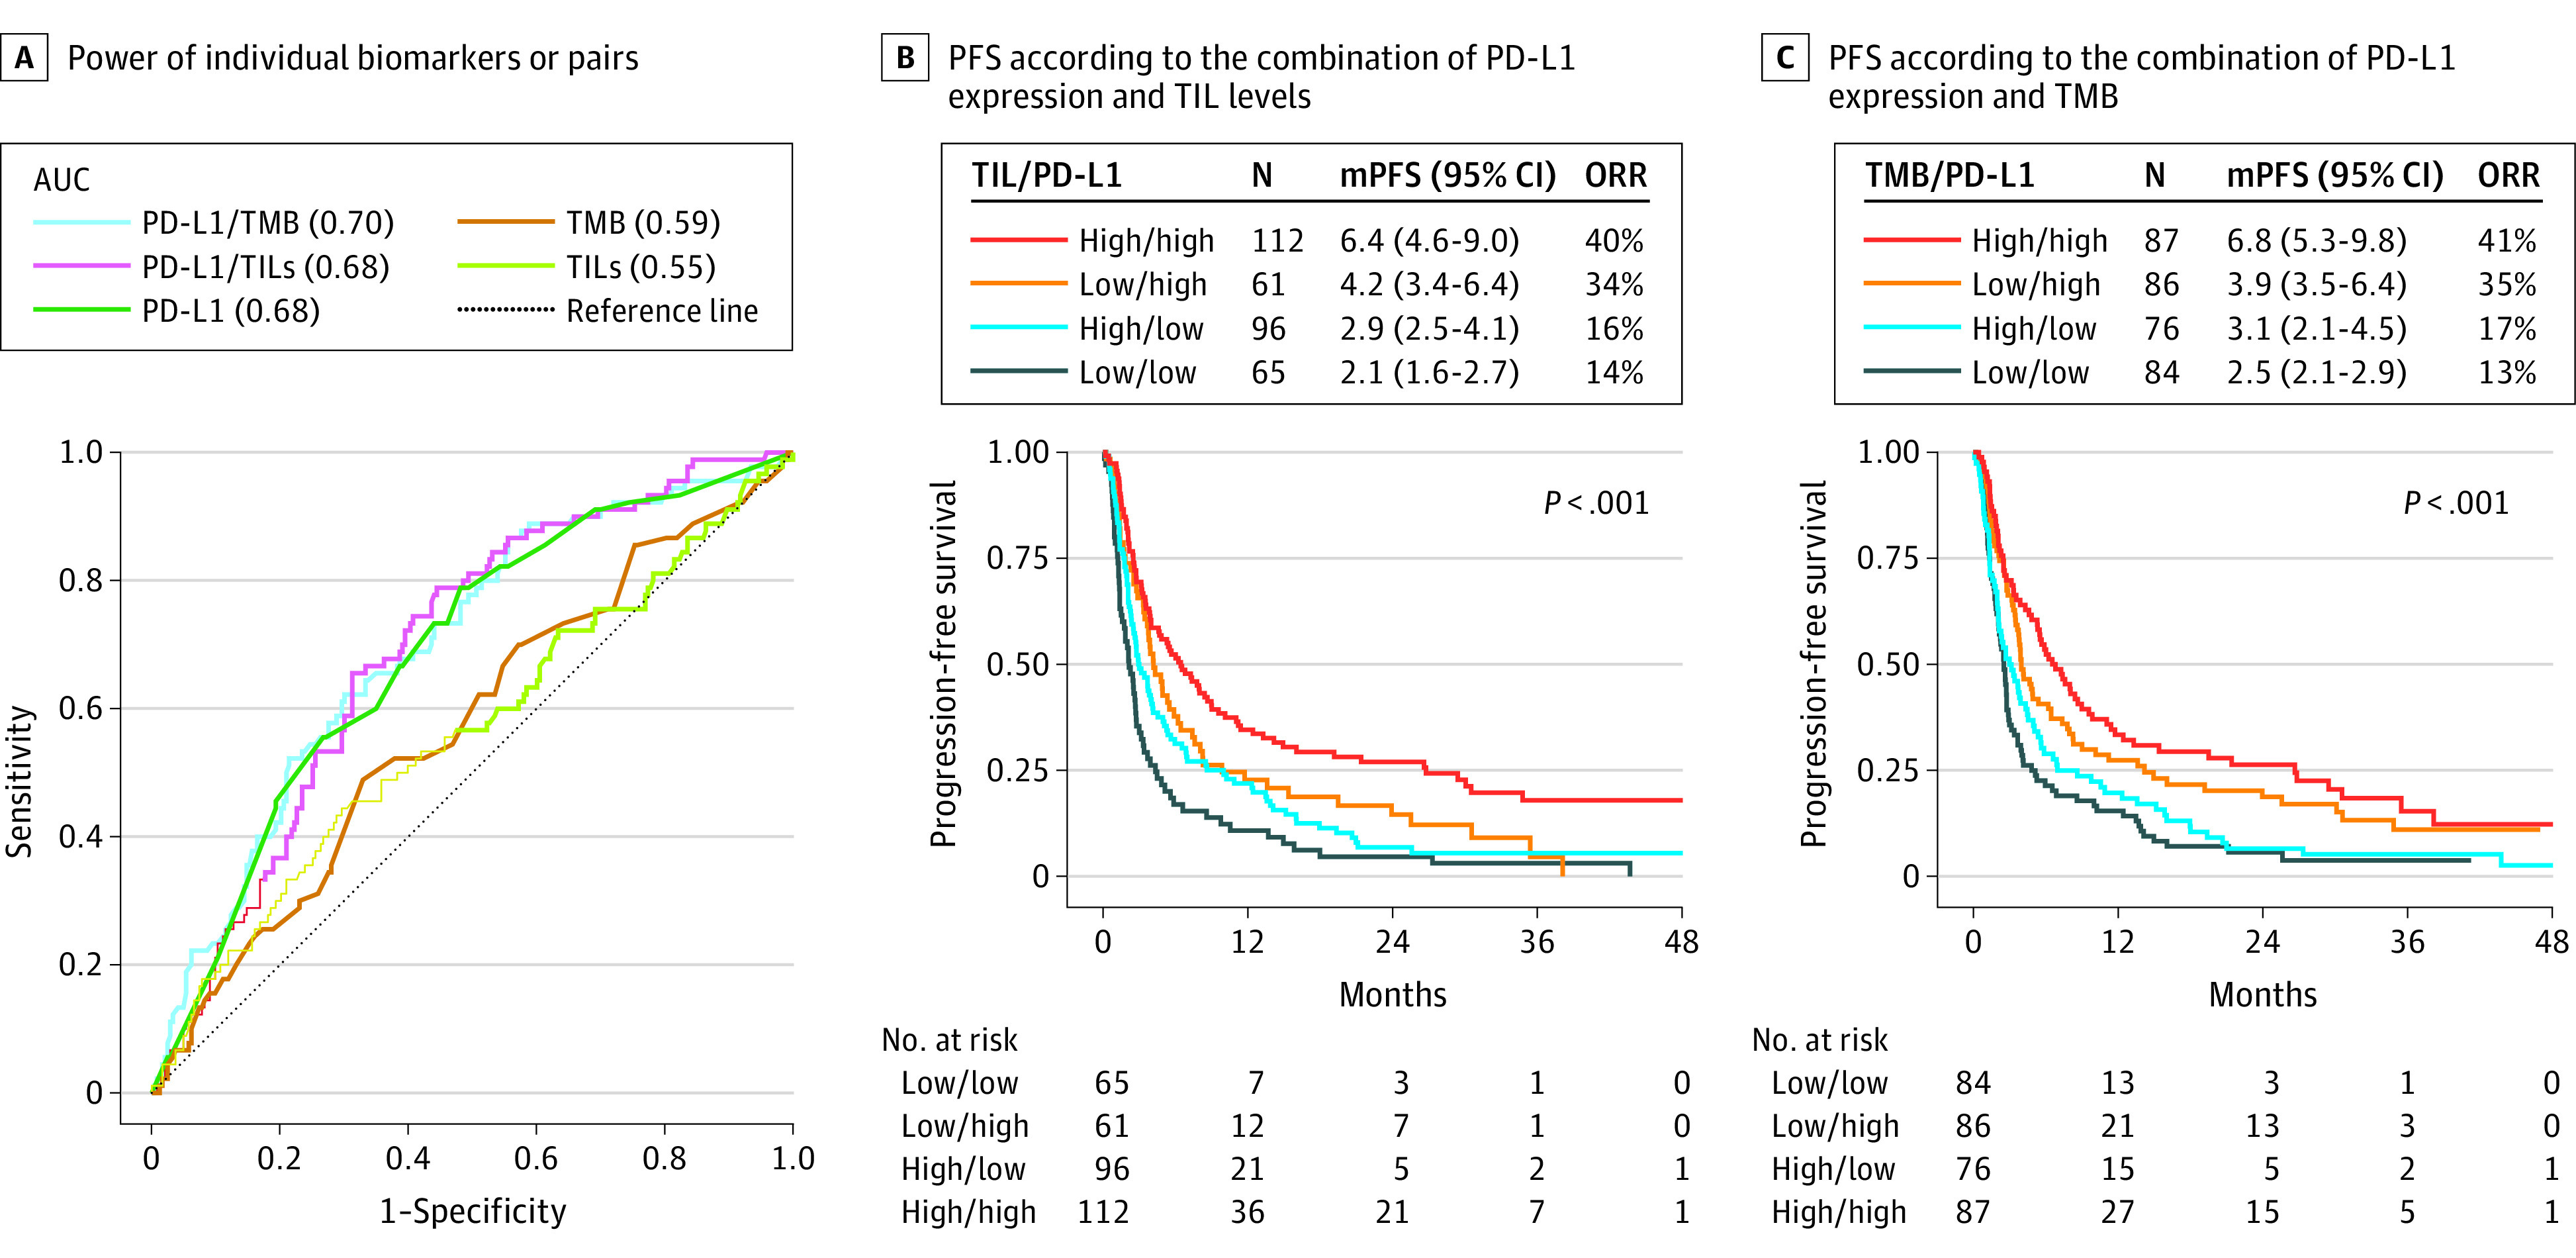
Figure 3. Combined Models.

A, Power of individual biomarkers (programmed death ligand-1 [PD-L1], tumor mutational burden [TMB], tumor-infiltrating lymphocytes [TILs]) or pairs with PD-L1 to predict immune checkpoint inhibitor response rate computing area under the receiver operating characteristic curve. B, Progression-free survival according to the combination of PD-L1 (<50 vs ≥50% ) expression and hematoxylin-eosin TIL levels (<250 vs ≥250 cells/mm2) scores. C, Progression-free survival according to the combination of PD-L1 (<50 vs ≥50%) expression and TMB (<10 vs ≥10 mu/Mb). mPFS indicates median PFS in months; ORR, objective response rate.
