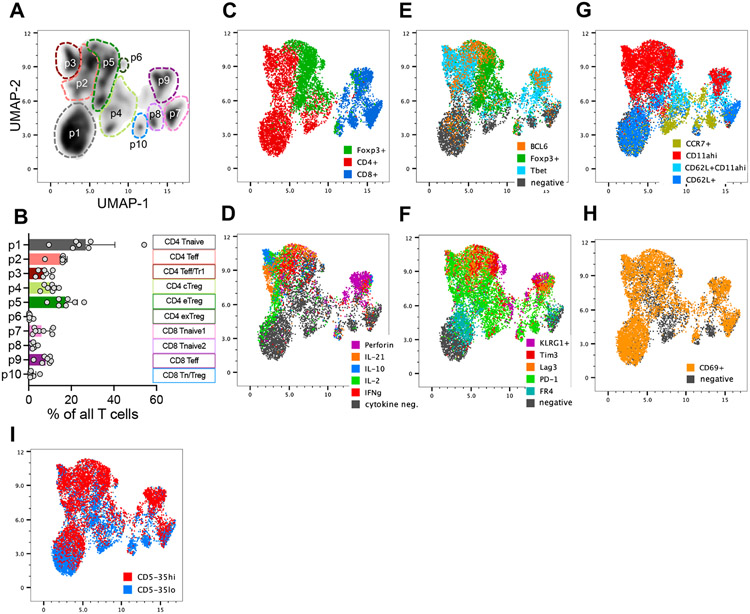
Figure 1. Functionally distinct T cell subpopulations infiltrate the pancreas during autoimmune diabetes.
Islet infiltrating T cells from pancreata of 8–12-week-old pre-diabetic female NOD mice were analyzed by flow cytometry after 5-hour restimulation in vitro with PMA and ionomycin. Analysis is gated on TCR+ T cells. (A) UMAP analysis based on a concatenated sample of TCR+ cells infiltrating the pancreatic islets of 7 individual female mice (see supplemental Figure 1). (B) Average frequency of each cluster among mice. Each point represents a single mouse, (n=7). (C-H) Indicated markers are backgated onto the UMAP populations. (I) CD5high (top 35%) and CD5low (bottom 35%) were determined by standard flow gating for CD8, CD4, and Foxp3+ T cell populations and backgated onto the UMAP plot. Error bars designate mean ± SD, n=7 mice, data from one experiment.

