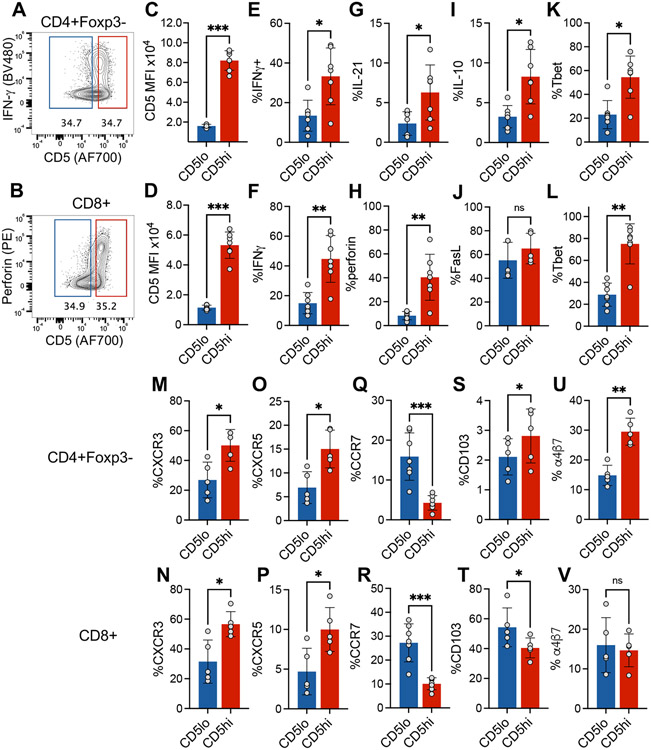
Figure 2. Increased activation of CD5high islet infiltrating T cells.
(A and B) Representative CD5 gating strategy. (C and D) CD5 MFI for CD4+ (C) and CD8+ T cells (D) after gating on CD5high or CD5low cells (top and bottom 35%). (E, G, I, K, M, O, Q, S, U) Analysis of CD5high or CD5low CD4+ T cells. (F, H, J, L, N, P, R, T, V) Analysis of CD5high or CD5low CD8+ T cells. Statistical analysis was performed using Mann-Whitney test (n=5-7). Error bars designate mean ± SD, n=5-7 mice, each point represents a single mouse, data from one experiment. *p<0.05, **p<0.01, ***p<0.001.

