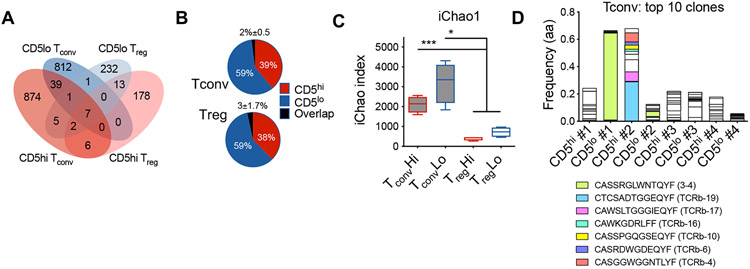
Figure 4. Distinct TCR repertoires of CD5high and CD5low T cells in pancreatic islets.
TCR-beta sequences were obtained from CD4+ Tconv (Foxp3GFP−) and Treg (Foxp3GFP+) cells sorted based on the level of CD5 expression from the islets of NOD.Foxp3GFP+ mice. (A) A representative analysis of TCR-beta amino acid (a.a.) sequence overlap among T cell populations of a single mouse. (B) Average of TCR-beta a.a. sequence overlap between CD5high and CD5low populations (n=4 mice, ±SD). (C) Sample TCR-beta diversity was calculated using iChao index. (D) Frequencies of top 10 T cell clones in Tconv populations. Colored bars designate CDR3 sequences shared with TCRs of known specificity (insulin B:9-23). The results are from one experiment (n=4 mice). Statistical analysis was performed using Two-way ANOVA. Error bars designate mean ± SD, *p<0.05; ***p<0.001.

