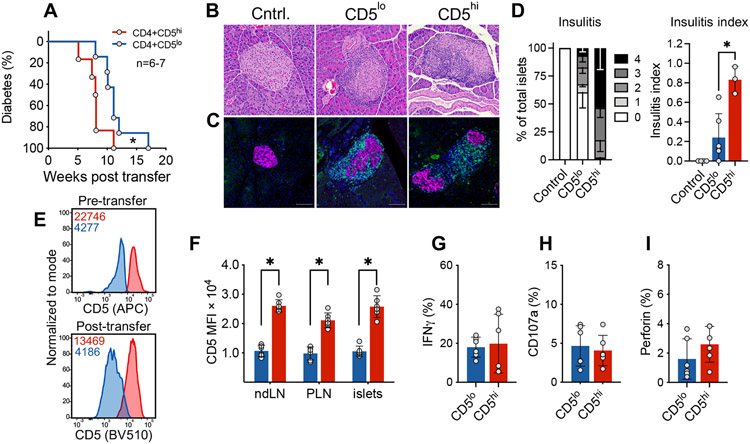
Figure 6. CD5low islet-infiltrating CD4+ T cells induce diabetes upon transfer.
CD4+Foxp3GFP− T cells were isolated from the islets of pre-diabetic 11-20 week old NOD.Foxp3GFP mice. Sorted cells were transferred into 4-8 week old NOD.TCRα−/− recipients. (A) Diabetes development, n=6-7. (B) Representative islet H&E from non-transferred (Cntrl.), CD5low cell recipient and CD5high recipient mice. (C) Immunofluorescent detection of transferred T cells (green) infiltrating the pancreatic islets (magenta) in control and transferred mice at 6 weeks post transfer. DAPI is depicted in blue; green is anti-CD3; magenta is BSRP-A marker of endocrine cells. (D) Cumulative histological (H&E) analysis of insulitis at 6 weeks post transfer (n=3-6 mice). Scale bar is 100um. (E) Representative flow plot analysis of CD5 expression on cells immediately after sorting and in the infiltrated pancreatic islets 5 weeks post-transfer. Numbers within flow plots represent MFI of the two populations; red is CD5high, blue is CD5low MFI. (F) Analysis shows the maintenance of high/low CD5 expression at the diabetes endpoint; ndLN = non-draining lymph nodes, PLN = pancreatic draining lymph nodes; n=6. (G-I) Transferred CD5high and CD5low CD4+ T cells were isolated from the islets of NOD.TCRα−/− recipients 5 weeks post transfer. Cells were restimulated with PMA/ionomycin; n=6. (A, E-I) are pooled from at least two independent experiments with n=6-7. (B, C) are representative of 3 independent experiments (Cntrl., n=4; CD5lo, n=6; CD5hi, n=3). (D) Insulitis scoring were performed on data pooled from 3 independent experiments (n=3-6). For each mouse, >100 islets from 5 consecutive layers (100μm apart) were scored. Statistical analysis was performed using Mantel-Cox (A) or Mann-Whitney (D-I). Error bars designate mean ± SEM in D, and mean ± SD in F-I, *p<0.05.

