
Figure 3.
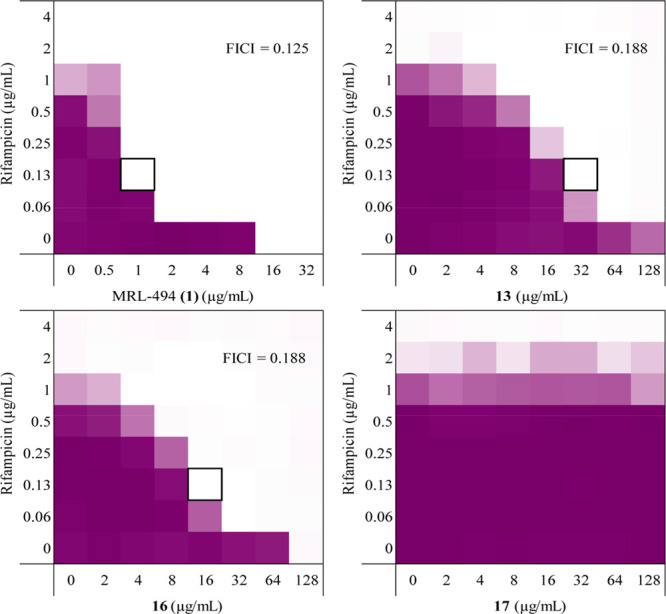
Checkerboard assay results for MRL-494 (1) and analogues 13, 16, and 17 in combination with rifampicin against E. coli ATCC 25922 (see Supporting Information Figures S1–S4 for checkerboard assays with other strains). The combination of test compound and rifampicin which resulted in the lowest FICI is indicated by a black box. The mean optical density of the bacterial growth (OD600) is shown as a color gradient, with purple signifying maximum bacterial growth and white as no growth.